Global gene expression analysis of reactive stroma in prostate cancer - PubMed (original) (raw)
Global gene expression analysis of reactive stroma in prostate cancer
Olga Dakhova et al. Clin Cancer Res. 2009.
Abstract
Purpose: Marked reactive stroma formation, designated as grade 3 reactive stroma, is associated with poor outcome in clinically localized prostate cancer. To understand the biological processes and signaling mechanisms underlying the formation of such reactive stroma, we carried out microarray gene expression analysis of laser-captured reactive stroma and matched normal stroma.
Experimental design: Seventeen cases of reactive stroma grade 3 cancer were used to laser-capture tumor and normal stroma. Expression analysis was carried out using Agilent 44K arrays. Up-regulation of selected genes was confirmed by quantitative reverse transcription-PCR. Expression data was analyzed to identify significantly up- and down-regulated genes, and gene ontology analysis was used to define pathways altered in reactive stroma.
Results: A total of 544 unique genes were significantly higher in the reactive stroma and 606 unique genes were lower. Gene ontology analysis revealed significant alterations in a number of novel processes in prostate cancer reactive stroma, including neurogenesis, axonogenesis, and the DNA damage/repair pathways, as well as evidence of increases in stem cells in prostate cancer reactive stroma.
Conclusions: Formation of reactive stroma in prostate cancer is a dynamic process characterized by significant alterations in growth factor and signal transduction pathways and formation of new structures, including nerves and axons.
Figures
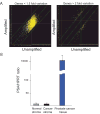
Figure 1. Validation of RNA amplification and laser capture
(A) Genes with no greater than 1.5-fold variation between amplified and unamplified RNA; 88.7% of genes met this criteria (left); genes with greater than 2-fold variation between amplified and unamplified RNAs (right), which constitute only 3% of the total. (B) Quantitative RT-PCR of PSA expression in laser captured normal and tumor stroma and prostate cancer tissue. PSA content of normal and tumor stroma was not significantly different and both were 1600-fold less than undissected prostate cancer tissue. Mean +/− of triplicate determinations is shown. PSA copy number was normalized to HPRT copy number relative to the Universal Reference RNA.
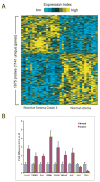
Figure 2. A gene transcription signature of Grade 3 reactive stroma in prostate cancer
(A) Heat map representation of 1675 gene probes (representing 1141 unique named genes) differentially expressed (P<0.01) in reactive prostate stroma compared to normal stroma (rows: genes, columns: profiled samples, yellow: high expression). (B) Quantitative RT-PCR validation of selected genes from the list of 1141 (P<0.05 for each, t-test). Mean +/− standard deviation of triplicate determinations is shown. HPRT was used for copy number normalization.
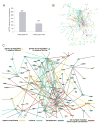
Figure 3. Interaction network analysis of reactive stroma genes
(A) Number of known human protein-protein interactions (from HPRD) involving the 1141 unique genes differentially expressed in reactive prostate stroma, as compared to that expected from a random gene set of 1141 (with +/− 1 SD, based on 1000 simulations). (B) Network representation of the entire set of 292 HPRD protein-protein interactions involving the 1141 named genes differentially expressed in reactive prostate stroma. (C) Subnetwork of HPRD protein-protein interactions from part (B). Nodes represent genes: yellow nodes, genes over-expressed in reactive stroma; blue nodes, genes under-expressed in reactive stroma. A line between two nodes signifies that the corresponding protein products of the genes can physically interact (according to the literature). Colored edges (other than gray) represent a common GO term annotation shared by both of the connected genes. Active hubs, or genes connected to a significant number (P < 0.01, one-sided Fisher’s exact test) of the other genes in the network, appear enlarged over the other nodes.
Figure 4. Expression patterns in breast cancer reactive stroma for genes over-expressed in prostate cancer reactive stroma
Referring to the profiling dataset from Finak et al.(15) of normal breast stroma (n=6) and breast cancer reactive stroma (n=52), the 776 transcript probes represented in that dataset and showing over-expression in Grade 3 prostate cancer reactive stroma (Figure 2A) were examined. Top panel, gene expression heat map (genes ordered from high to low expression in reactive stroma). Bottom panel, average expression of the (mean centroid-centered) genes for the corresponding sample profiles. Unique genes (those with a common name) showing over-expression in both prostate and breast reactive stroma in indicated region (P<0.01 each dataset) are listed.
Comment in
- Characterization and functional role of the stroma compartment in prostate tumors.
Bergh A. Bergh A. Future Oncol. 2009 Oct;5(8):1231-5. doi: 10.2217/fon.09.104. Future Oncol. 2009. PMID: 19852737 No abstract available.
Similar articles
- Genes upregulated in prostate cancer reactive stroma promote prostate cancer progression in vivo.
Dakhova O, Rowley D, Ittmann M. Dakhova O, et al. Clin Cancer Res. 2014 Jan 1;20(1):100-9. doi: 10.1158/1078-0432.CCR-13-1184. Epub 2013 Oct 22. Clin Cancer Res. 2014. PMID: 24150235 Free PMC article. - Identification of prognostic molecular features in the reactive stroma of human breast and prostate cancer.
Planche A, Bacac M, Provero P, Fusco C, Delorenzi M, Stehle JC, Stamenkovic I. Planche A, et al. PLoS One. 2011;6(5):e18640. doi: 10.1371/journal.pone.0018640. Epub 2011 May 18. PLoS One. 2011. PMID: 21611158 Free PMC article. - Analysis of gene expression in prostate cancer epithelial and interstitial stromal cells using laser capture microdissection.
Gregg JL, Brown KE, Mintz EM, Piontkivska H, Fraizer GC. Gregg JL, et al. BMC Cancer. 2010 Apr 28;10:165. doi: 10.1186/1471-2407-10-165. BMC Cancer. 2010. PMID: 20426842 Free PMC article. - Reactive stroma in prostate cancer progression.
Tuxhorn JA, Ayala GE, Rowley DR. Tuxhorn JA, et al. J Urol. 2001 Dec;166(6):2472-83. J Urol. 2001. PMID: 11696814 Review. - [Gene expression profiling in prostatic cancer].
Ernst T, Hergenhahn M, Kenzelmann M, Cohen CD, Ikinger U, Kretzler M, Hollstein M, Gröne HJ. Ernst T, et al. Verh Dtsch Ges Pathol. 2002;86:165-75. Verh Dtsch Ges Pathol. 2002. PMID: 12647366 Review. German.
Cited by
- DNA damage induces GDNF secretion in the tumor microenvironment with paracrine effects promoting prostate cancer treatment resistance.
Huber RM, Lucas JM, Gomez-Sarosi LA, Coleman I, Zhao S, Coleman R, Nelson PS. Huber RM, et al. Oncotarget. 2015 Feb 10;6(4):2134-47. doi: 10.18632/oncotarget.3040. Oncotarget. 2015. PMID: 25575823 Free PMC article. - Serum Proteins, HMMR, NXPH4, PITX1 and THBS4; A Panel of Biomarkers for Early Diagnosis of Hepatocellular Carcinoma.
Eun JW, Jang JW, Yang HD, Kim J, Kim SY, Na MJ, Shin E, Ha JW, Jeon S, Ahn YM, Park WS, Nam SW. Eun JW, et al. J Clin Med. 2022 Apr 11;11(8):2128. doi: 10.3390/jcm11082128. J Clin Med. 2022. PMID: 35456219 Free PMC article. - Expression of pleiotrophin in the prostate is androgen regulated and it functions as an autocrine regulator of mesenchyme and cancer associated fibroblasts and as a paracrine regulator of epithelia.
Orr B, Vanpoucke G, Grace OC, Smith L, Anderson RA, Riddick AC, Franco OE, Hayward SW, Thomson AA. Orr B, et al. Prostate. 2011 Feb 15;71(3):305-17. doi: 10.1002/pros.21244. Epub 2010 Sep 1. Prostate. 2011. PMID: 20812209 Free PMC article. - Intravital microscopy in the mouse dorsal chamber model for the study of solid tumors.
Baron VT, Welsh J, Abedinpour P, Borgström P. Baron VT, et al. Am J Cancer Res. 2011;1(5):674-86. Epub 2011 May 1. Am J Cancer Res. 2011. PMID: 21994905 Free PMC article. - Molecular profiling of a lethal tumor microenvironment, as defined by stromal caveolin-1 status in breast cancers.
Witkiewicz AK, Kline J, Queenan M, Brody JR, Tsirigos A, Bilal E, Pavlides S, Ertel A, Sotgia F, Lisanti MP. Witkiewicz AK, et al. Cell Cycle. 2011 Jun 1;10(11):1794-809. doi: 10.4161/cc.10.11.15675. Epub 2011 Jun 1. Cell Cycle. 2011. PMID: 21521946 Free PMC article.
References
- Tuxhorn JA, Ayala GE, Rowley DR. Reactive stroma in prostate cancer progression. J Urol. 2001;166:2472–83. - PubMed
- Chung LW, Baseman A, Assikis V, Zhau HE. Molecular insights into prostate cancer progression: the missing link of tumor microenvironment. J Urol. 2005;173:10–20. - PubMed
- Alberti C. Prostate cancer progression and surrounding microenvironment. Int J Biol Markers. 2006;21:88–95. - PubMed
- Tuxhorn JA, Ayala GE, Smith MJ, Smith VC, Dang TD, Rowley DR. Reactive stroma in human prostate cancer: induction of myofibroblast phenotype and extracellular matrix remodeling. Clin Cancer Res. 2002;8:2912–23. - PubMed
- Tuxhorn JA, McAlhany SJ, Dang TD, Ayala GE, Rowley DR. Stromal cells promote angiogenesis and growth of human prostate tumors in a differential reactive stroma (DRS) xenograft model. Cancer Res. 2002;62:3298–307. - PubMed
Publication types
MeSH terms
Grants and funding
- U54 CA126568/CA/NCI NIH HHS/United States
- 1U54CA126568/CA/NCI NIH HHS/United States
- P50 CA058204-13S1/CA/NCI NIH HHS/United States
- P30CA125123/CA/NCI NIH HHS/United States
- P50 CA058204/CA/NCI NIH HHS/United States
- U54 CA126568-019001/CA/NCI NIH HHS/United States
- P30 CA125123/CA/NCI NIH HHS/United States
- P50CA058204/CA/NCI NIH HHS/United States
LinkOut - more resources
Full Text Sources
Other Literature Sources
Medical


