An intramolecular signaling element that modulates dynamin function in vitro and in vivo - PubMed (original) (raw)
An intramolecular signaling element that modulates dynamin function in vitro and in vivo
Joshua S Chappie et al. Mol Biol Cell. 2009 Aug.
Abstract
Dynamin exhibits a high basal rate of GTP hydrolysis that is enhanced by self-assembly on a lipid template. Dynamin's GTPase effector domain (GED) is required for this stimulation, though its mechanism of action is poorly understood. Recent structural work has suggested that GED may physically dock with the GTPase domain to exert its stimulatory effects. To examine how these interactions activate dynamin, we engineered a minimal GTPase-GED fusion protein (GG) that reconstitutes dynamin's basal GTPase activity and utilized it to define the structural framework that mediates GED's association with the GTPase domain. Chemical cross-linking of GG and mutagenesis of full-length dynamin establishes that the GTPase-GED interface is comprised of the N- and C-terminal helices of the GTPase domain and the C-terminus of GED. We further show that this interface is essential for structural stability in full-length dynamin. Finally, we identify mutations in this interface that disrupt assembly-stimulated GTP hydrolysis and dynamin-catalyzed membrane fission in vitro and impair the late stages of clathrin-mediated endocytosis in vivo. These data suggest that the components of the GTPase-GED interface act as an intramolecular signaling module, which we term the bundle signaling element, that can modulate dynamin function in vitro and in vivo.
Figures
Figure 1.
Model of dynamin GG interface. (A) Crystal structure of rat dynamin GTPase domain (green) fused to myosin motor core (PDB: 2aka). A helix from the myosin (red) packs onto a hydrophobic groove comprised of the N- and C-termini (teal) of the GTPase domain. Hydrophobic side chains are shown in yellow. The myosin helix is predicted to mimic the GED docking arrangement. (B) Sequence alignments of the NGTPase, CGTPase, and CGED regions. Hs, Homo sapiens; Rn, Rattus norvegicus; Dm, Drosophila melanogaster; Ce, Caenorhabditis elegans; Sc, S. cerevisiae; Dd, Dictyostelium discoideum; Dyn, dynamin. Black boxes indicate conserved hydrophobic residues. Green and cyan bars indicate the helical segments presumed to form the helical bundle that is modeled in C. Asterisk denotes the position of the kink in the CGTPase helix. (C) Helical wheel diagrams of the GTPase and GED helices. Yellow, hydrophobic residues; green, GTPase residues; cyan, GED residues. The plots are arranged in the putative docking arrangement, with the conserved residues in B forming the buried hydrophobic core between the three helices.
Figure 2.
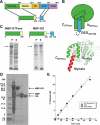
Design and functional characterization of a minimal GTPase-GED fusion (GG). (A) Design of GG fusion. Dashed line represents flexible linker connecting the GTPase and GED fragments. (B) Diagram depicting the putative folding of GG. The crystal structure of the rat dynamin-myosin fusion (PDB: 2aka), which was used as a model to guide the design, is shown below for comparison. (C) Solubility of human dynamin1 GTPase domain in the absence (left) or presence (right) of the C-terminal GED helix. Proteins were expressed in E. coli as MBP fusions. Black arrows indicate bands corresponding to MBP-GTPase and MBP-GG, respectively. (D) Purification of GG from E. coli. GG was expressed as an MBP fusion and purified by a three-column procedure as described in Materials and Methods. Lane 1, soluble fraction following cell lysis; lane 2: pooled amylose column elutions; lane 3, sample from lane 2 after cleavage of MBP tag by PreScission protease; lane 4, purified GG after anion exchange and size exclusion chromatography to remove the MBP. Arrows denote the bands corresponding to MBP-GG fusion, MBP, and GG. (E) GTPase activities of purified GG and GG S45N. Proteins were assayed at a concentration of 2 μM in buffer containing 20 mM HEPES, pH 7.5, 150 mM KCl, 1 mM MgCl2 and 500 μM GTP. The activity of HA-tagged full-length dynamin-1 under the same reaction conditions is shown for comparison.
Figure 3.
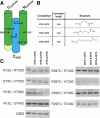
Intramolecular cross-linking of GTPase and GED helices. (A) Residues selected for double cysteine mutagenesis in GG. Cysteine pairs included one substitution in the GTPase domain (R15C in NGTPase or R297C in CGTPase) and one substitution in the CGED region (R730C, H733C, K736C, or S740C). (B) Structure and estimated distances of bifunctional methanthiosulfonate (MTS) cross-linkers used for analyzing interactions between GTPase and GED helices in GG. (C) MTS cross-linking of GG double cysteine mutants. Cross-linkers were incubated with GG and analyzed by SDS-PAGE and Coomassie staining as described in Materials and Methods.
Figure 4.
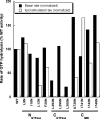
Basal and assembly-stimulated GTPase activities of interface mutants in vitro. Normalized activity for each mutant is expressed as a percentage of wild-type activity. All mutations were assayed in the context of full-length dynamin at a concentration of 0.5 μM in buffer containing 20 mM HEPES, pH 7.5, 150 mM KCl, 1 mM MgCl2, and 500 μM GTP. Activity was measured on the soluble fraction of each sample. The data presented here derive from an initial screen aimed at identifying potentially interesting interface mutant phenotypes.
Figure 5.
Self-assembly properties of interface mutants. (A) Sedimentation of interface mutants (1 μM) in the absence of liposomes. After sedimentation, supernatant (S) and pellet (P) fractions were analyzed by SDS-PAGE. T, total amount of protein in the initial mixture. (B) Sedimentation of interface mutants (1 μM) in the presence of 0.1-μm PIP2-containing liposomes (300 μM). (C) Representative electron micrographs of interface mutants assembled on 0.4-μm PIP2-containing liposomes. Scale bar, 200 nm.
Figure 6.
Membrane fission by class II interface mutants in vitro. Fluorescent SUPER templates were prepared as described in Materials and Methods. ■, fission by 0.5 μM dynamin in the absence of nucleotide; □, fission in the presence of 1 mM GTP.
Figure 7.
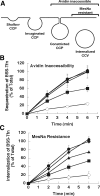
Class II interface mutants disrupt clathrin-mediated endocytosis in vivo. (A) Diagram of endocytosis intermediates and their accessibility to the avidin and MesNa probes. (B and C) Dynamin-2 knockout (Dyn2 KO) cells expressing either GFP (○) or the following GFP-tagged Dyn2 constructs: WT (•), L12N (■), F20N (▴), or A738N (♦) were generated as described in Materials and Methods. Endocytosis in these cells was quantified using biotinylated transferrin (BSS-Tfn) as the ligand and measuring its uptake into an avidin- (B) or MesNa- (C) inaccessible compartment. The amount of uptake is expressed as a percentage of the total surface-bound BSS-Tfn.
Figure 8.
L12N alters the morphology of clathrin-coated pits in reconstituted Dyn2 KO cells. Clathrin-coated pits were visualized by indirect immunofluorescence using the AP6 mAb directed against the α-adaptins of AP2. Dynamin-2 constructs (WT, L12N, F20N, or A738N) were localized using GFP fluorescence. White boxes in each merged image indicate sections magnified in the panels on the right.
Figure 9.
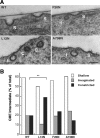
L12N increases the number of late endocytic intermediates in reconstituted Dyn2 KO cells. (A) Thin sections of Dyn2 KO cells reconstituted with GFP-tagged Dyn2 proteins (WT, L12N, and F20N and A738N, as indicated) were prepared and imaged as described in Materials and Methods. Scale bar, 200 nm. Endocytic intermediates were counted and scored as shallow (S), invaginated (I), or constricted (C) CCPs as indicated. (B) Quantitation of CCP intermediates expressed as % of total CCPs scored (n = 79, 90, 87, and 61 for WT, L12N, F20N, and A738N, respectively). **p < 0.01 in t test.
Similar articles
- G domain dimerization controls dynamin's assembly-stimulated GTPase activity.
Chappie JS, Acharya S, Leonard M, Schmid SL, Dyda F. Chappie JS, et al. Nature. 2010 May 27;465(7297):435-40. doi: 10.1038/nature09032. Epub 2010 Apr 28. Nature. 2010. PMID: 20428113 Free PMC article. - Domain structure and intramolecular regulation of dynamin GTPase.
Muhlberg AB, Warnock DE, Schmid SL. Muhlberg AB, et al. EMBO J. 1997 Nov 17;16(22):6676-83. doi: 10.1093/emboj/16.22.6676. EMBO J. 1997. PMID: 9362482 Free PMC article. - SNX9 regulates dynamin assembly and is required for efficient clathrin-mediated endocytosis.
Soulet F, Yarar D, Leonard M, Schmid SL. Soulet F, et al. Mol Biol Cell. 2005 Apr;16(4):2058-67. doi: 10.1091/mbc.e04-11-1016. Epub 2005 Feb 9. Mol Biol Cell. 2005. PMID: 15703209 Free PMC article. - Dynamin and its role in membrane fission.
Hinshaw JE. Hinshaw JE. Annu Rev Cell Dev Biol. 2000;16:483-519. doi: 10.1146/annurev.cellbio.16.1.483. Annu Rev Cell Dev Biol. 2000. PMID: 11031245 Free PMC article. Review. - Building a fission machine--structural insights into dynamin assembly and activation.
Chappie JS, Dyda F. Chappie JS, et al. J Cell Sci. 2013 Jul 1;126(Pt 13):2773-84. doi: 10.1242/jcs.108845. Epub 2013 Jun 18. J Cell Sci. 2013. PMID: 23781021 Free PMC article. Review.
Cited by
- Dynamin-Like Proteins Are Potentially Involved in Membrane Dynamics within Chloroplasts and Cyanobacteria.
Jilly R, Khan NZ, Aronsson H, Schneider D. Jilly R, et al. Front Plant Sci. 2018 Feb 22;9:206. doi: 10.3389/fpls.2018.00206. eCollection 2018. Front Plant Sci. 2018. PMID: 29520287 Free PMC article. - Intrapolypeptide interactions between the GTPase effector domain (GED) and the GTPase domain form the bundle signaling element in dynamin dimers.
Srinivasan S, Mattila JP, Schmid SL. Srinivasan S, et al. Biochemistry. 2014 Sep 16;53(36):5724-6. doi: 10.1021/bi500998s. Epub 2014 Sep 2. Biochemistry. 2014. PMID: 25171143 Free PMC article. - Oligomerization and GTP-binding Requirements of MxA for Viral Target Recognition and Antiviral Activity against Influenza A Virus.
Nigg PE, Pavlovic J. Nigg PE, et al. J Biol Chem. 2015 Dec 11;290(50):29893-906. doi: 10.1074/jbc.M115.681494. Epub 2015 Oct 27. J Biol Chem. 2015. PMID: 26507657 Free PMC article. - Functional mapping of human dynamin-1-like GTPase domain based on x-ray structure analyses.
Wenger J, Klinglmayr E, Fröhlich C, Eibl C, Gimeno A, Hessenberger M, Puehringer S, Daumke O, Goettig P. Wenger J, et al. PLoS One. 2013 Aug 19;8(8):e71835. doi: 10.1371/journal.pone.0071835. eCollection 2013. PLoS One. 2013. PMID: 23977156 Free PMC article. - Crystal structure of nucleotide-free dynamin.
Faelber K, Posor Y, Gao S, Held M, Roske Y, Schulze D, Haucke V, Noé F, Daumke O. Faelber K, et al. Nature. 2011 Sep 18;477(7366):556-60. doi: 10.1038/nature10369. Nature. 2011. PMID: 21927000
References
- Barylko B., Binns D., Lin K. M., Atkinson M. A., Jameson D. M., Yin H. L., Albanesi J. P. Synergistic activation of dynamin GTPase by Grb2 and phosphoinositides. J. Biol. Chem. 1998;273:3791–3797. - PubMed
- Chen Y. J., Zhang P., Egelman E. H., Hinshaw J. E. The stalk region of dynamin drives the constriction of dynamin tubes. Nat. Struct. Mol. Biol. 2004;11:574–575. - PubMed
- Chugh J., Chatterjee A., Kumar A., Mishra R. K., Mittal R., Hosur R. V. Structural characterization of the large soluble oligomers of the GTPase effector domain of dynamin. FEBS J. 2006;273:388–397. - PubMed
- Conner S. D., Schmid S. L. Regulated portals of entry into the cell. Nature. 2003;422:37–44. - PubMed
Publication types
MeSH terms
Substances
Grants and funding
- P41 RR17573/RR/NCRR NIH HHS/United States
- R37 MH061345/MH/NIMH NIH HHS/United States
- P41 RR017573/RR/NCRR NIH HHS/United States
- R01 MH061345/MH/NIMH NIH HHS/United States
- GM042455/GM/NIGMS NIH HHS/United States
- MH081419/MH/NIMH NIH HHS/United States
- R01 GM042455/GM/NIGMS NIH HHS/United States
- F31 MH081419/MH/NIMH NIH HHS/United States
- MH061345/MH/NIMH NIH HHS/United States
LinkOut - more resources
Full Text Sources
Other Literature Sources

