Timing of the ovarian circadian clock is regulated by gonadotropins - PubMed (original) (raw)
Timing of the ovarian circadian clock is regulated by gonadotropins
Tomoko Yoshikawa et al. Endocrinology. 2009 Sep.
Abstract
The timing of ovulation is critically important to the success of reproduction. Current thinking attributes the timing of ovulation to LH secretion by the pituitary, itself timed by signals from the hypothalamus. The discovery of an internal circadian timer in the ovary raises the possibility that ovulation is in fact timed by an interaction between clocks in the hypothalamus/pituitary and those in the ovary. We asked whether ovarian clocks were influenced by signals from the brain and pituitary. Ovaries of Period1-luciferase transgenic rats display circadian rhythms in vitro. To determine whether the phase of these rhythms is set by neural or endocrine signals, we surgically denervated or heterotopically transplanted ovaries with or without encapsulation in dialysis membranes. Animals' light-dark cycles were phase advanced or delayed 6 h, and the resetting of the ovarian clock was tracked by culturing ovaries at intervals over the next 12 d. Resetting trajectories of control, surgically denervated, and encapsulated ovaries were similar, demonstrating that endocrine signals are sufficient to transmit phase information to the ovary. We next evaluated LH and FSH as potential endocrine signals. Using the phase of Per1-luc expression in granulosa cell cultures, we demonstrated that both of these pituitary hormones caused large phase shifts when applied to the cultured cells. We hypothesize that the ovarian circadian clock is entrained by hormonal signals from the pituitary and that ovulation depends, in part, on the phase in the ovarian circadian cycle at which these signals occur.
Figures
Figure 1
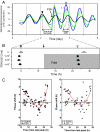
Effects of surgical denervation on the resetting trajectory of the ovarian clock. A, Representative _Per1_-luc expression rhythms of cultured ovaries from animals subjected to a 6-h advance of the LD cycle (green, control; orange, nerve-sectioned). Black and white bars at the bottom of each panel on d 1 indicate the LD cycles to which the animals were exposed before euthanasia and tissue collection. The cultures were prepared before the LD cycle shift (d 0, top panel), on d 1 (middle panel), and on d 6 (bottom panel) of the shifted LD cycle. When data from all the cultures were analyzed, there was no significant difference in phase or amplitude of the rhythms between control and nerve-sectioned ovaries. B, Resetting trajectories of _Per1_-luc expression rhythms in the control and nerve-sectioned ovaries. Time is indicated by position on the circle. Light conditions at the time of killing are shown by shading. The peak phase of each culture is represented by small circles (green, control ovary; orange, nerve-sectioned ovary). Arrows inside the large circles indicate the average phase of each group. The degree of synchrony within each group is directly related to the length of the arrow. Black arrowheads within the large circles show the point of complete phase shift, or target (i.e. 6 h advanced or delayed from the phase on d 0). The dotted line within the large circle indicates the mean phase before the shift (baseline). Numbers in the large circles indicate the number of rhythmic cultures over the number of total cultures. Note that this ratio is always 1 except for cultures from advanced animals.
Figure 2
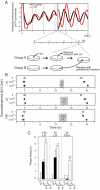
Phase resetting of the ovarian clock after heterotopic transplant with or without isolation in dialysis membranes. A, Representative _Per1_-luc expression rhythms from cultured ovaries prepared before a 6-h LD cycle shift (Cont, control ovary). The black and white bar at the bottom of the panel on d 1 indicates the LD cycle to which the animals had been entrained before euthanasia and tissue collection. Encapsulated cultures consistently showed lower-amplitude rhythms. B, Resetting trajectories of _Per1_-luc expression rhythms in control and transplanted ovaries. Control ovary, SQ, and E-SQ transplants were cultured 0, 1, 6, and 12 d after the light cycle shifts (details are as in Fig. 1). Advance and delay shifts were completed by d 12 and 6, respectively, in the control ovaries and the E-SQ transplants, whereas SQ transplants did not reach to the target phase by d 12 after either advance or delay shifts. The dotted line within the large circle indicates the mean phase before the shift (baseline). C, Amplitude (mean ±
sem
) of phase shifts in _Per1_-luc expression rhythms in control and transplanted ovaries after a 6-h phase advance (left panel) or delay (right panel) of the LD cycle. The dashed lines in both panels of C represent the target phase (marked with a black arrowhead in B), and a positive value on the y-axis indicates a phase delay. *, P < 0.05; **, P < 0.01, ANOVA followed by Tukey post hoc test).
Figure 3
_Per1_-luc expression in primary granulosa cell cultures. A, _Per1_-luc expression rhythm recorded by photomultiplier tube from a granulosa cell culture. Although rhythmicity gradually damped, it was restored by a medium change. B, Bioluminescence image of cultured granulosa cells recorded with an ICCD camera. A set of three cells are shown at the times of low (upper panel) and high (12 h later, lower panel) _Per1_-luc expression. C, Superimposed plots of _Per1_-luc rhythms from five individual granulosa cells in a culture recorded with an ICCD camera. Individual cells showed different peak phases. Cells were imaged after 5 d in vitro immediately after a medium change.
Figure 4
Gonadotropin-induced phase shifts of the _Per1_-luc rhythm in cultured granulosa cells. A, Representative bioluminescence rhythm from three granulosa cell cultures. Culture medium was changed at the beginning of the record. Vehicle (black) or FSH at two concentrations (0.1 IU/1.2 ml, dark blue; 1.0 IU/1.2 ml, green) was added to the cultures at the time indicated by the vertical arrow. Black and white arrowheads indicate peak phases of cultures on the day before and after the addition of FSH, respectively. B, Mean peak phases (±
sem
) of cultures before and after addition of FSH to culture [rhythmic cultures/total cultures: controls 0 IU/1.2 ml (3/3); FSH 1 × 10⁻³ IU /1.2 ml (4/4), 1 × 10⁻² IU /1.2 ml (4/4), 1 × 10⁻¹ IU /1.2 ml (4/4)]. The peak phase of control culture is plotted as 0 h. The shaded area indicates the presence of FSH in the cultures. Cultures treated with FSH (•) are phase advanced compared with control cultures (○, saline treated); however, no dose dependency was seen within the range of concentrations tested (1 × 10⁻⁶ to 1.0 IU/ 1.2 ml). C, PRCs of _Per1_-luc rhythms in response to several concentrations of FSH and LH (1 × 10⁻⁶, 1 × 10⁻⁵, 1 × 10⁻⁴, 1 × 10⁻³, 1 × 10⁻², 1 × 10⁻¹ IU/1.2 ml) added to cultures of granulosa cells at different circadian times. The amount of the phase shift is plotted against the duration of time since the last peak of _Per1_-luc expression. The amount and direction of the shift depend on the time of FSH or LH application to the cultures but not on the concentration of hormone. The effect of vehicle addition is indicated by open circles; the effect of addition of hormone is indicated by filled diamonds (FSH) or triangles (LH). Data from the various concentrations of hormone are not indicated because we did not observe a dose-dependent response. In C, the solid red lines represent nonlinear best-fit lines for the shifted data from both LH- and FSH-treated cultures, whereas the dashed black lines are fitted to the data from saline-treated cultures.
Figure 5
Gonadotropin-induced phase shifts of the _Per1_-luc rhythm in cultured granulosa cells after transient exposure and conditioned medium replacement. A, Experimental protocol for giving LH or FSH treatments of short duration to granulosa cell cultures. At the start of the experiment, two equal groups of cultures were prepared. Hormone was added to one group of cultures, and 1.5 or 3 h later, the hormone-containing medium was removed and replaced with medium from the untreated group of cultures. B, Significant phase delays were produced by LH [1.5-h dose (5/5), top panel; 3-h dose (3/ 3), _middle panel_] or FSH (3 h; 5/5, bottom panel). Shaded areas indicate timing of LH or FSH treatments. C, Mean (±
sem
) phase delays induced by the gonadotropins (black bar, 1 × 10⁻⁶ IU/1.2 ml; white bars, 1 × 10⁻⁴ IU/1.2 ml). Both high (1 × 10⁻⁴ IU/1.2 ml) and low (1 × 10⁻⁶ IU/1.2 ml) doses induced significant delays when compared with vehicle treatment (t test: #, P < 0.05). The higher dose induced larger phase delays than the low dose (1 × 10⁻⁶ IU vs. 1 × 10⁻⁴ IU, t test: *, P < 0.02; **, P < 0.01).
Similar articles
- Gonadotropic regulation of circadian clockwork in rat granulosa cells.
He PJ, Hirata M, Yamauchi N, Hashimoto S, Hattori MA. He PJ, et al. Mol Cell Biochem. 2007 Aug;302(1-2):111-8. doi: 10.1007/s11010-007-9432-7. Epub 2007 May 5. Mol Cell Biochem. 2007. PMID: 17483911 - Circadian clock function in the mammalian ovary.
Sellix MT. Sellix MT. J Biol Rhythms. 2015 Feb;30(1):7-19. doi: 10.1177/0748730414554222. Epub 2014 Nov 3. J Biol Rhythms. 2015. PMID: 25367899 Review. - Conditional Deletion of Bmal1 in Ovarian Theca Cells Disrupts Ovulation in Female Mice.
Mereness AL, Murphy ZC, Forrestel AC, Butler S, Ko C, Richards JS, Sellix MT. Mereness AL, et al. Endocrinology. 2016 Feb;157(2):913-27. doi: 10.1210/en.2015-1645. Epub 2015 Dec 15. Endocrinology. 2016. PMID: 26671182 Free PMC article. - Alterations of circadian clockworks during differentiation and apoptosis of rat ovarian cells.
Chu G, Yoshida K, Narahara S, Uchikawa M, Kawamura M, Yamauchi N, Xi Y, Shigeyoshi Y, Hashimoto S, Hattori MA. Chu G, et al. Chronobiol Int. 2011 Jul;28(6):477-87. doi: 10.3109/07420528.2011.589933. Chronobiol Int. 2011. PMID: 21797776 - Interrelationships between the hypothalamus, pituitary gland, ovary, adrenal gland, and the open period for LH release in the hen (Gallus domesticus).
Etches RJ, Petitte JN, Anderson-Langmuir CE. Etches RJ, et al. J Exp Zool. 1984 Dec;232(3):501-11. doi: 10.1002/jez.1402320317. J Exp Zool. 1984. PMID: 6394694 Review.
Cited by
- Slice preparation, organotypic tissue culturing and luciferase recording of clock gene activity in the suprachiasmatic nucleus.
Savelyev SA, Larsson KC, Johansson AS, Lundkvist GB. Savelyev SA, et al. J Vis Exp. 2011 Feb 15;(48):2439. doi: 10.3791/2439. J Vis Exp. 2011. PMID: 21372784 Free PMC article. - Disrupted reproduction, estrous cycle, and circadian rhythms in female mice deficient in vasoactive intestinal peptide.
Loh DH, Kuljis DA, Azuma L, Wu Y, Truong D, Wang HB, Colwell CS. Loh DH, et al. J Biol Rhythms. 2014 Oct;29(5):355-69. doi: 10.1177/0748730414549767. Epub 2014 Sep 24. J Biol Rhythms. 2014. PMID: 25252712 Free PMC article. - Rhythmic expression of circadian clock genes in the preovulatory ovarian follicles of the laying hen.
Zhang Z, Lai S, Wang Y, Li L, Yin H, Wang Y, Zhao X, Li D, Yang M, Zhu Q. Zhang Z, et al. PLoS One. 2017 Jun 12;12(6):e0179019. doi: 10.1371/journal.pone.0179019. eCollection 2017. PLoS One. 2017. PMID: 28604799 Free PMC article. - Secretome from estrogen-responding human placenta-derived mesenchymal stem cells rescues ovarian function and circadian rhythm in mice with cyclophosphamide-induced primary ovarian insufficiency.
Le DC, Ngo MT, Kuo YC, Chen SH, Lin CY, Ling TY, Pham QTT, Au HK, Myung J, Huang YH. Le DC, et al. J Biomed Sci. 2024 Oct 11;31(1):95. doi: 10.1186/s12929-024-01085-8. J Biomed Sci. 2024. PMID: 39390588 Free PMC article. - Circadian rhythms of glucocorticoid hormone actions in target tissues: potential clinical implications.
Kino T. Kino T. Sci Signal. 2012 Oct 2;5(244):pt4. doi: 10.1126/scisignal.2003333. Sci Signal. 2012. PMID: 23033538 Free PMC article.
References
- Yamazaki S, Numano R, Abe M, Hida A, Takahashi R, Ueda M, Block GD, Sakaki Y, Menaker M, Tei H 2000 Resetting central and peripheral circadian oscillators in transgenic rats. Science 288:682–685 - PubMed
- Yoo SH, Yamazaki S, Lowrey PL, Shimomura K, Ko CH, Buhr ED, Siepka SM, Hong HK, Oh WJ, Yoo OJ, Menaker M, Takahashi JS 2004 PERIOD2::LUCIFERASE real-time reporting of circadian dynamics reveals persistent circadian oscillations in mouse peripheral tissues. Proc Natl Acad Sci USA 101:5339–5346 - PMC - PubMed


