Autophagy suppresses tumorigenesis through elimination of p62 - PubMed (original) (raw)
. 2009 Jun 12;137(6):1062-75.
doi: 10.1016/j.cell.2009.03.048.
Cristina M Karp, Brian Beaudoin, Nhan Vuong, Guanghua Chen, Hsin-Yi Chen, Kevin Bray, Anupama Reddy, Gyan Bhanot, Celine Gelinas, Robert S Dipaola, Vassiliki Karantza-Wadsworth, Eileen White
Affiliations
- PMID: 19524509
- PMCID: PMC2802318
- DOI: 10.1016/j.cell.2009.03.048
Autophagy suppresses tumorigenesis through elimination of p62
Robin Mathew et al. Cell. 2009.
Erratum in
- Cell. 2011 Apr 15;145(2):322
Abstract
Allelic loss of the essential autophagy gene beclin1 occurs in human cancers and renders mice tumor-prone suggesting that autophagy is a tumor-suppression mechanism. While tumor cells utilize autophagy to survive metabolic stress, autophagy also mitigates the resulting cellular damage that may limit tumorigenesis. In response to stress, autophagy-defective tumor cells preferentially accumulated p62/SQSTM1 (p62), endoplasmic reticulum (ER) chaperones, damaged mitochondria, reactive oxygen species (ROS), and genome damage. Moreover, suppressing ROS or p62 accumulation prevented damage resulting from autophagy defects indicating that failure to regulate p62 caused oxidative stress. Importantly, sustained p62 expression resulting from autophagy defects was sufficient to alter NF-kappaB regulation and gene expression and to promote tumorigenesis. Thus, defective autophagy is a mechanism for p62 upregulation commonly observed in human tumors that contributes directly to tumorigenesis likely by perturbing the signal transduction adaptor function of p62-controlling pathways critical for oncogenesis.
Figures
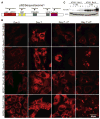
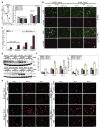
Figure 1. Elevated and persistent p62 in autophagy-defective tumor cells under metabolic stress
(A) Domain organization of p62 illustrating the Phox and Bem1p (PB1) oligomerization domain (p62 and atypical Protein Kinase C [aPKC]), the Zinc finger (ZZ) Rip 1 binding domain, the TRAF6 binding site (TBS), the microtubule associated protein light chain 3 (LC3) domain (LC3/ATG8 binding), and the ubiquitin-associated (UBA) (poly-ubiquitin binding). (B) IF of endogenous p62 showing accumulation and persistence of p62 in autophagy-defective cells under normal growth conditions (Day 0), 7 days of metabolic stress (Day 7I), and 1 (Day 7+1R) and 2 (Day 7+1R) days of recovery. (C) Autophagy-defective cells express constitutively higher levels of exogenous Myc-p62. Six independent cell lines of Bcl-2-expressing atg5+/+ and _atg5_−/− iBMK cells stably expressing Myc-tagged p62 were evaluated for p62 expression levels by Western blotting with an antibody to Myc tag.
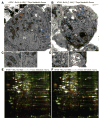
Figure 2. Metabolic stress promotes organelle damage and ER chaperones and PDI upregulation in autophagy-deficient cells
(A–D) Representative electron micrographs of Bcl-2-expressing atg5+/+ (A) or _atg5_−/− (B) cells following 7 days of metabolic stress. Bcl-2 expressing atg5+/+ iBMK cell (A) showing mitochondria (M, blue arrows and C, left panel), ER (E, red arrows and C, right panel), mutant cell in (B) showing mitochondria (M, blue arrows and D, left panel), and protein aggregates (A, yellow and D, right panel). (E and F) 2-DIGE gels showing differential regulation of ER chaperones (GRp170, GRp78), PDI, PDI-P4Hβ and ACO2 in Bcl-2-expressing _atg5_−/− iBMK cells in response to metabolic stress (7 days). Total protein from unstressed or metabolically stressed (7 days) Bcl-2-expressing atg5+/+ and _atg5_−/− cell lines were labeled with Cy3 (Green-unstressed) or Cy5 (Red-stressed) and analyzed by 2-DIGE. Images show 2-DIGE gels with proteins that are induced (Red), repressed (Green) or unchanged (Yellow) under metabolic stress. Protein spots (n=106) that were differentially expressed were selected and identified by mass spectrometry.
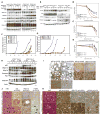
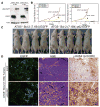
Figure 3. Autophagy defects promote ER stress and elevated DNA damage response in tumors in vivo
(A) Western blots showing levels of p62, ER chaperones, PDI and ubiquitin in Bcl-2-expressing beclin1+/+, beclin1+/−, atg5+/+ and _atg5_−/− iBMK cells following 5 or 7 days of metabolic stress, and 1 and 2 days of recovery. Values below the bands represent relative signal intensities compared to the basal protein level in the first lane in each group (untreated Bcl-2-expressing beclin1+/+ and atg5+/+ control). (B–D) Allelic loss of beclin1 sensitizes cells selectively to ER stress and proteasome inhibition. MTT assays showing sensitivity of Bcl-2-expressing beclin1+/+(Blue) and beclin1+/− (Red) iBMK cells in response to increasing concentrations of (B) tunicamycin (3 days), or (C) epoxomycin (2 days), and (D) following 5 days of metabolic stress. Data are presented as mean ± SD. (E) Autophagy deficiency causes mitochondrial damage. Western blots showing levels of mitochondrial proteins (ACO2, LON, SOD2 and PRDX3) in Bcl-2-expressing beclin1+/+, beclin1+/−, atg5+/+ and _atg5_−/− iBMK cells, following metabolic stress. (F) Deficiency in atg5 in iBMK cells promotes tumorigenesis. Tumor allograft growth of atg5+/+ (red), atg5+/− (yellow) and _atg5_−/− (blue) iBMK cell lines in nude mice. (G) Deficiency in atg5 cooperates with defective apoptosis enhances tumor growth. Tumor allograft growth of Bcl-2-expressing atg5+/+ (red), and _atg5_−/− (blue) iBMK cell lines in nude mice. (H) Western blot showing elevated p62 and ER chaperones and PDI in Bcl-2-expressing atg5+/+ and _atg5_−/− iBMK tumors in (I) Elevated p62 and GRp170 levels in lung and heart tissues and spontaneous lung tumors from beclin1+/− mice. Lung, heart and spontaneous lung tumor sections from two 1.5-year-old beclin1+/+ and four 1.5-year-old beclin1+/− mice were stained for p62 and GRp170 by IHC. Sections were independently scored and analyzed by Students t-test (lung) or Mann-Whitney test (heart) and a p < 0.05 was considered statistically significant. (J) Elevated p62 and GRp170 in liver tissue and p62, Mallory-Denk bodies (H&E, arrows) and γ-H2AX (arrows) in spontaneous liver tumors from beclin1+/− mice (1.5 years). Sections were independently scored and analyzed by Students t-test for significance (p < 0.05). (K) Elevated p62, GRp170, and γ-H2AX positive nuclei in human HCC. Representative images from a human liver TMA (46 samples), showing H&E, p62, GRp170 and γ-H2AX accumulation in HCCs. Representative images from a normal human liver TMA (14 samples) are shown for comparison. Sections were independently scored and analyzed by Students t-test for significance for significance (p < 0.05).
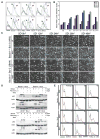
Figure 4. Metabolic stress promotes elevated ROS production and chromosomal instability in autophagy-deficient cells
(A) Autophagy-deficiency leads to elevated ROS production. Overlays show ROS levels in Bcl-2-expressing beclin1+/+ (Green) and beclin1+/− iBMK cells (Blue) (x-axis, log scale) under normal growth (0Di) and at 0.5, 1, 2.5 and 24 hr (beclin1+/+, green arrows and beclin1+/−, red arrows) during recovery (0.5–24hR) from 5 days of metabolic stress (5Di) by flow-cytometry using the ROS sensor DCF-DA. The ROS levels in untreated cells are shown in dotted lines for comparison. (B) Representative histogram from three independent experiments measuring the mean ROS levels in Bcl-2-expressing beclin1+/+ and beclin1+/− iBMK cells shown in (A). (C) ROS scavenging partially rescues the susceptibility to metabolic stress and recovery due to allelic loss of beclin1. Representative time-lapse images of Bcl-2-expressing beclin1+/+ and beclin1+/− iBMK cells during recovery following 5 days of metabolic stress in presence (NAC) and absence (UT) of the ROS scavenger NAC (1mM) (relative percentage of adherent cells compared to time 0 is shown). (D) ROS scavenging suppresses p62 accumulation in autophagy-deficient (beclin1+/− and _atg5_−/−) cells. Western blot analysis of p62 levels in Bcl-2-expressing beclin1+/+, beclin1+/−, atg5+/+ and _atg5_−/− iBMK cell lines following 0 or 7 days of metabolic stress followed by 1 day recovery without and with NAC. (E) ROS scavenging limits progression to aneuploidy associated with allelic loss of beclin1. Flow-cytometry analysis of DNA content in diploid, Bcl-2-expressing beclin1+/+ and beclin1+/− iBMK cells grown in presence (blue) or absence (red) of the ROS scavenger NAC (1mM). Numbers represent passage numbers at which ploidy was determined.
Figure 5. Failure to eliminate p62 by autophagy activates the DNA damage response
(A) p62 expression leads to elevated ROS production in the autophagy-defective beclin1+/− cells. Bcl-2-expressing beclin1+/+ and beclin1+/− iBMK cells were transfected with myc-tagged p62 or control vector and ROS levels (DCF-DA) were measured by flow-cytometry at day 3 post-transfection. Histogram on the right is representative of three independent experiments measuring mean ROS level in each cell line on days 1 and 3 post-transfection. (B) Failure to eliminate p62 by autophagy under metabolic stress leads to DNA damage response induction. Bcl-2-expressing atg5+/+ or _atg5_−/− iBMK cells stably expressing EGFP or p62-EGFP were subjected to 3 days of metabolic stress, allowed to recover (1 day) and stained for γ-H2AX. (C) Quantitation of the percentage cells with γ-H2AX positive foci in cells shown in (B). Data from 200 cells are presented as mean ± SD. (D) Western blots of RNAi-knockdown of p62. Bcl-2-expressing wild-type (beclin1+/+ and atg5+/+) and autophagy-defective (beclin1+/− and _atg5_−/−) iBMK cells were transfected with either Lamin- or p62-siRNA and subjected to metabolic stress for 0, 24, 48 or 72 hr (24, 48, 72 and 96 hr post-transfection, respectively) and analyzed for p62 levels. (E) p62 accumulation in autophagy-defective cells is responsible for activation of the DNA damage response. Cells in (D) were evaluated for γ-H2AX positive nuclear foci. (F) Quantitation of percentage cells with γ-H2AX positive nuclei from the data shown in (E). Data from two hundred cells are presented as mean ± SD.
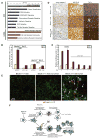
Figure 6. p62 expression cooperates with autophagy-deficiency to promote tumor growth
(A) Western blot for EGFP, in Bcl-2-expressing atg5+/+ and _atg5_−/− iBMK cells stably expressing EGFP or p62-EGFP. (B) Tumor growth of cell lines in (A) showing enhanced tumor growth in p62-EGFP expressing _atg5_−/− tumors (red) compared to that of the control vector (yellow). (C) Panel showing tumor-bearing mice injected with p62-EGFP- (right panel), and EGFP- expressing (left panel) _atg5_−/− iBMK cells from (B), at day 74 post-injection. (D) Tumors from p62-EGFP expressing _atg5_−/− cells are associated with p62 aggregates and polymorphic and γ-H2AX positive nuclei. Representative photomicrographs of frozen tumor sections (left), and paraffin embedded sections stained by H&E (middle) or IHC for γ-H2AX (right) [Students t-test for significance for significance (p < 0.05)] in tumors from _atg5_−/− cells shown in (C).
Figure 7. Accumulation of p62 in autophagy-defective cells alters signal transduction pathways involved in host and anti-oxidant defense
(A) Pathways (p=0.05; yellow line) suppressed in tumors from _atg5_−/− iBMK cells expressing p62-EGFP compared to those expressing EGFP analyzed by IPA (blue bars) and by GSEA (purple bars). (B) Luciferase-reporter assays in Bcl-2 expressing wild-type (beclin1+/+) and autophagy-defective (beclin1+/−) iBMK cells showing suppression of IL-6-Luciferase reporter (NF-κB activity) in autophagy-defective cells by p62. (C) Luciferase-reporter assays in Bcl-2 expressing beclin1+/+ iBMK (WB3) cells showing that over-expression of p62 is sufficient to suppress NF-κB transcriptional activity in a concentration dependant manner. (D) Impaired hepatocyte survival, activation of NF-κB and cytokine production in beclin1+/− liver and beclin1+/− liver tumors. IHC staining showing elevated levels apoptotic cell death (active caspase-3), NF-κB activation (nuclear p50), and cytokine production (TNF-α) in liver tissue and spontaneous liver tumors from _beclin1_−/− mice. (E) Defective autophagy and accumulation of p62 suppress NF-κB activation and promotes HCC. Representative photomicrographs of frozen liver sections from beclin1+/+ and beclin1+/− and spontaneous HCC from beclin1+/− mice, immunostained for p62 (red) and p65 NF-κB (green) and analyzed by confocal microscopy. Note that those beclin1+/− hepatocytes that accumulate p62 do not display nuclear p65 (yellow arrows) whereas those without p62 display nuclear localization of p65 indicative of NF-κB activation. (F) A model for the role of autophagy as a tumor suppressor mechanism by limiting p62 accumulation.
Similar articles
- p62 at the crossroads of autophagy, apoptosis, and cancer.
Moscat J, Diaz-Meco MT. Moscat J, et al. Cell. 2009 Jun 12;137(6):1001-4. doi: 10.1016/j.cell.2009.05.023. Cell. 2009. PMID: 19524504 Free PMC article. Review. - p62 at the interface of autophagy, oxidative stress signaling, and cancer.
Nezis IP, Stenmark H. Nezis IP, et al. Antioxid Redox Signal. 2012 Sep 1;17(5):786-93. doi: 10.1089/ars.2011.4394. Epub 2012 Jan 11. Antioxid Redox Signal. 2012. PMID: 22074114 Review. - Lipopolysaccharide stimulates p62-dependent autophagy-like aggregate clearance in hepatocytes.
Chen C, Deng M, Sun Q, Loughran P, Billiar TR, Scott MJ. Chen C, et al. Biomed Res Int. 2014;2014:267350. doi: 10.1155/2014/267350. Epub 2014 Feb 10. Biomed Res Int. 2014. PMID: 24683544 Free PMC article. - Identification of 6-phosphofructo-2-kinase/fructose-2,6-bisphosphatase as a novel autophagy regulator by high content shRNA screening.
Strohecker AM, Joshi S, Possemato R, Abraham RT, Sabatini DM, White E. Strohecker AM, et al. Oncogene. 2015 Nov 5;34(45):5662-76. doi: 10.1038/onc.2015.23. Epub 2015 Mar 16. Oncogene. 2015. PMID: 25772235 Free PMC article. - BAG2 ameliorates endoplasmic reticulum stress-induced cell apoptosis in _Mycobacterium tuberculosis_-infected macrophages through selective autophagy.
Liang S, Wang F, Bao C, Han J, Guo Y, Liu F, Zhang Y. Liang S, et al. Autophagy. 2020 Aug;16(8):1453-1467. doi: 10.1080/15548627.2019.1687214. Epub 2019 Nov 11. Autophagy. 2020. PMID: 31711362 Free PMC article.
Cited by
- Autophagy protein p62/SQSTM1 is involved in HAMLET-induced cell death by modulating apotosis in U87MG cells.
Zhang YB, Gong JL, Xing TY, Zheng SP, Ding W. Zhang YB, et al. Cell Death Dis. 2013 Mar 21;4(3):e550. doi: 10.1038/cddis.2013.77. Cell Death Dis. 2013. PMID: 23519119 Free PMC article. - Modulation of diverse biological processes by CPSF, the master regulator of mRNA 3' ends.
Liu L, Manley JL. Liu L, et al. RNA. 2024 Aug 16;30(9):1122-1140. doi: 10.1261/rna.080108.124. RNA. 2024. PMID: 38986572 Free PMC article. Review. - ATF4 orchestrates a program of BH3-only protein expression in severe hypoxia.
Pike LR, Phadwal K, Simon AK, Harris AL. Pike LR, et al. Mol Biol Rep. 2012 Dec;39(12):10811-22. doi: 10.1007/s11033-012-1975-3. Epub 2012 Oct 23. Mol Biol Rep. 2012. PMID: 23090478 - Death Associated Protein Kinase 1 (DAPK1): A Regulator of Apoptosis and Autophagy.
Singh P, Ravanan P, Talwar P. Singh P, et al. Front Mol Neurosci. 2016 Jun 23;9:46. doi: 10.3389/fnmol.2016.00046. eCollection 2016. Front Mol Neurosci. 2016. PMID: 27445685 Free PMC article. Review. - Regulation of lipid stores and metabolism by lipophagy.
Liu K, Czaja MJ. Liu K, et al. Cell Death Differ. 2013 Jan;20(1):3-11. doi: 10.1038/cdd.2012.63. Epub 2012 May 18. Cell Death Differ. 2013. PMID: 22595754 Free PMC article. Review.
References
- Balajee AS, Geard CR. Replication protein A and gamma-H2AX foci assembly is triggered by cellular response to DNA double-strand breaks. Exp Cell Res. 2004;300:320–334. - PubMed
- Degenhardt K, Sundararajan R, Lindsten T, Thompson C, White E. Bax and Bak independently promote cytochrome C release from mitochondria. J Biol Chem. 2002;277:14127–14134. - PubMed
Publication types
MeSH terms
Substances
Grants and funding
- R00 CA133181/CA/NCI NIH HHS/United States
- R37 CA53370/CA/NCI NIH HHS/United States
- R01 CA130893-01A1/CA/NCI NIH HHS/United States
- R37 CA053370-18/CA/NCI NIH HHS/United States
- R37 CA053370/CA/NCI NIH HHS/United States
- R01 CA130893/CA/NCI NIH HHS/United States
- R00 CA133181-02/CA/NCI NIH HHS/United States
- K99 CA133181/CA/NCI NIH HHS/United States
LinkOut - more resources
Full Text Sources
Other Literature Sources
