Molecular tuning of odorant receptors and its implication for odor signal processing - PubMed (original) (raw)
Review
Molecular tuning of odorant receptors and its implication for odor signal processing
Johannes Reisert et al. Chem Senses. 2009 Sep.
Abstract
The discovery of the odorant receptor (OR) family by Buck and Axel in 1991 provided a quantum jump in our understanding of olfactory function. However, the study of the responsiveness of ORs to odor ligands was challenging due to the difficulties in deorphanizing the receptors. In this manuscript, we review recent findings of OR responsiveness that have come about through improved OR deorphanization methods, site-directed mutagenesis, structural modeling studies, and studies of OR responses in situ in olfactory sensory neurons. Although there has been a major leap in our understanding of receptor-ligand interactions and how these contribute to the input to the olfactory system, an improvement of our understanding of receptor structure and dynamics and interactions with intracellular and extracellular proteins is necessary.
Figures
Figure 1
Odorant responses of rat olfactory sensory neurons in situ. Two electrodes were inserted though an opening in the dorsal surface of a rat head to reach the olfactory epithelium. A large diameter tip electrode recorded the electroolfactogram (A), whereas a metal-filled sharp electrode recorded single olfactory sensory neuron action potential activity (B). The odorant ethyl butyrate was delivered in the air phase for the duration of the bar at the top of each recording. Reprinted from Gesteland and Sigwart (1977) with permission from Elsevier.
Figure 2
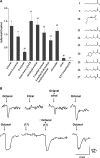
Responsiveness of OR I7 to C8 aldehydes. This figure is taken with permission from the study of Araneda et al. (2000) where they recorded odor responses for I7 through EOG recordings in rats whose olfactory epithelium had been transduced with an adenovirus that expressed rat I7 (Ad-I7). (A) Comparison of the EOG responses to analogs of octanal. All compounds are shown at 10−3 M except for citral (10−2 M). Citral, only at this high concentration, produced a small but significantly increased response (P < 0.001). At all concentrations tested, 2,5,7-trimethyl-2-octenal did not produce a significant increase in responses in infected animals. All other C8 analogs had increased responses (P < 0.001) at 10−3 M. Control responses were EOG responses from epithelium transduced with adenovirus that did not carry the coding region for I7. (B) Citral reduced octanal responses, as shown in Ca2+ imaging, in isolated olfactory neurons expressing I7 receptors. I7-expressing cells were recognized by the presence of GFP. Octanal (10 and 30 μM, top and bottom panels, respectively) produced an increase in Ca2+ as shown by the change in the emitted light. In the presence of citral (100 μM), top, but not in the presence of 2,5,5-trimethyl-2-octenal (100 μM), bottom, the response to octanal is reduced.
Figure 3
Recording odorant-induced responses from olfactory sensory neurons expressing the M71 OR. (A) The introduction of IRES-tauGFP into the mouse genome following the coding sequence for the M71 OR allowed the identification and visualization of all M71-expressing olfactory sensory neurons, which are found in the most dorsal zone on the olfactory turbinates. Scalebar, 250 μm. (B) Screening of GFP-positive olfactory sensory neurons using Ca2+ imaging and a variety of odorants revealed the M71 agonists acetophenone (Acp) and benzaldehyde (Bnz). Note the ∼10-fold shift difference in sensitivity. Modified from Bozza et al. (2002) with permission from the Society of Neuroscience.
Figure 4
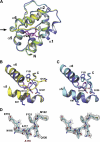
Structure of LUSHD118A Mutant Protein Mimics cVA-Bound LUSH Protein. (A) Ribbon diagram comparing one monomer from the asymmetric unit of the LUSH–cVA complex (blue) with the LUSHD118A (cyan), apo-LUSH (green), and LUSH–butanol complex (yellow). The cVA is shown as a stick model in magenta. Arrow indicates position of structural changes in the C-terminal loop shared by LUSHD118A (cyan) and LUSH–cVA (blue) but distinct from the LUSH–butanol complex (yellow) and apo-LUSH (data not shown). (B) Comparison of the structures of the 117–121 loop in the LUSH–butanol (yellow) and LUSH–cVA (blue) complexes. (C) Comparison of the structures of the same regions between LUSH–cVA (blue) and apo-LUSHD118A (cyan). LUSH–cVA and LUSHD118A adopt similar conformations. (D) Stereo representation of the electron density defining the loop between residues E115–M122 in the LUSHD118A structure solved without cVA. The position of A118 is indicated in red. The electron density is from a 2Fo−Fc map contoured at 1_σ_. Reproduced with permission from Laughlin et al. (2008).
Similar articles
- Odor discrimination by G protein-coupled olfactory receptors.
Touhara K. Touhara K. Microsc Res Tech. 2002 Aug 1;58(3):135-41. doi: 10.1002/jemt.10131. Microsc Res Tech. 2002. PMID: 12203691 Review. - Deorphanization and characterization of human olfactory receptors in heterologous cells.
Chatelain P, Veithen A, Wilkin F, Philippeau M. Chatelain P, et al. Chem Biodivers. 2014 Nov;11(11):1764-81. doi: 10.1002/cbdv.201400083. Chem Biodivers. 2014. PMID: 25408322 - Molecular Basis of Mammalian Odor Discrimination: A Status Report.
Block E. Block E. J Agric Food Chem. 2018 Dec 26;66(51):13346-13366. doi: 10.1021/acs.jafc.8b04471. Epub 2018 Dec 7. J Agric Food Chem. 2018. PMID: 30453735 Review. - Molecular biology of odorant receptors in vertebrates.
Mombaerts P. Mombaerts P. Annu Rev Neurosci. 1999;22:487-509. doi: 10.1146/annurev.neuro.22.1.487. Annu Rev Neurosci. 1999. PMID: 10202546 Review. - Deorphanizing vertebrate olfactory receptors: recent advances in odorant-response assays.
Touhara K. Touhara K. Neurochem Int. 2007 Jul-Sep;51(2-4):132-9. doi: 10.1016/j.neuint.2007.05.020. Epub 2007 Jun 13. Neurochem Int. 2007. PMID: 17640771 Review.
Cited by
- Achieving singularity in mammalian odorant receptor gene choice.
McClintock TS. McClintock TS. Chem Senses. 2010 Jul;35(6):447-57. doi: 10.1093/chemse/bjq041. Epub 2010 May 11. Chem Senses. 2010. PMID: 20460312 Free PMC article. Review. - Perspectives on: information and coding in mammalian sensory physiology: response kinetics of olfactory receptor neurons and the implications in olfactory coding.
Reisert J, Zhao H. Reisert J, et al. J Gen Physiol. 2011 Sep;138(3):303-10. doi: 10.1085/jgp.201110645. J Gen Physiol. 2011. PMID: 21875979 Free PMC article. No abstract available. - Distinct sets of olfactory receptors highly expressed in different human tissues evaluated by meta-transcriptome analysis: Association of OR10A6 in skin with keratinization.
Nakanishi S, Tsutsui T, Itai N, Denda M. Nakanishi S, et al. Front Cell Dev Biol. 2023 Jan 26;11:1102585. doi: 10.3389/fcell.2023.1102585. eCollection 2023. Front Cell Dev Biol. 2023. PMID: 36776557 Free PMC article. - Molecular components of signal amplification in olfactory sensory cilia.
Hengl T, Kaneko H, Dauner K, Vocke K, Frings S, Möhrlen F. Hengl T, et al. Proc Natl Acad Sci U S A. 2010 Mar 30;107(13):6052-7. doi: 10.1073/pnas.0909032107. Epub 2010 Mar 15. Proc Natl Acad Sci U S A. 2010. PMID: 20231443 Free PMC article. - Agonists for 13 trace amine-associated receptors provide insight into the molecular basis of odor selectivity.
Ferrero DM, Wacker D, Roque MA, Baldwin MW, Stevens RC, Liberles SD. Ferrero DM, et al. ACS Chem Biol. 2012 Jul 20;7(7):1184-9. doi: 10.1021/cb300111e. Epub 2012 May 7. ACS Chem Biol. 2012. PMID: 22545963 Free PMC article.
References
- Abaffy T, Malhotra A, Luetje CW. The molecular basis for ligand specificity in a mouse olfactory receptor: a network of functionally important residues. J Biol Chem. 2007;282:1216–1224. - PubMed
- Amoore JE. Psychophysics of odor. Cold Spring Harb Symp Quant Biol. 1965;30:623–637. - PubMed
- Amoore JE. Specific anosmia: a clue to the olfactory code. Nature. 1967;214:1095–1098. - PubMed
- Araneda RC, Kini AD, Firestein S. The molecular receptive range of an odorant receptor. Nat Neurosci. 2000;3:1248–1255. - PubMed
Publication types
MeSH terms
Substances
LinkOut - more resources
Full Text Sources


