Measuring the rates of spontaneous mutation from deep and large-scale polymorphism data - PubMed (original) (raw)
Measuring the rates of spontaneous mutation from deep and large-scale polymorphism data
Philipp W Messer. Genetics. 2009 Aug.
Abstract
The rates and patterns of spontaneous mutation are fundamental parameters of molecular evolution. Current methodology either tries to measure such rates and patterns directly in mutation-accumulation experiments or tries to infer them indirectly from levels of divergence or polymorphism. While experimental approaches are constrained by the low rate at which new mutations occur, indirect approaches suffer from their underlying assumption that mutations are effectively neutral. Here I present a maximum-likelihood approach to estimate mutation rates from large-scale polymorphism data. It is demonstrated that the method is not sensitive to demography and the distribution of selection coefficients among mutations when applied to mutations at sufficiently low population frequencies. With the many large-scale sequencing projects currently underway, for instance, the 1000 genomes project in humans, plenty of the required low-frequency polymorphism data will shortly become available. My method will allow for an accurate and unbiased inference of mutation rates and patterns from such data sets at high spatial resolution. I discuss how the assessment of several long-standing problems of evolutionary biology would benefit from the availability of accurate mutation rate estimates.
Figures
Figure 1.—
Expected number of mutant alleles present at frequency x in a population. Distributions _g_γ(x) are shown for several different selection classes, always using μγ = 1. The solid line is the neutral asymptotics, _g_0(x) = 2/x, which in the double-logarithmic plot appear as a straight line with slope −1. Compared with neutral mutations, deleterious mutations (γ < 0) are systematically suppressed from reaching higher frequencies in the population, and beneficial mutations (γ > 0) are enriched at high frequencies. In the low-frequency limit all distributions converge to the neutral SFS, although convergence occurs substantially faster for beneficial than for deleterious mutations.
Figure 2.—
Probability density Pr(x | k, n) that a neutral mutation has population frequency x in a population of size N = 104 if it is observed in k of n = 1000 genotyped sequences.
Figure 3.—
Expected relative errors according to Equation 24 for nonneutral mutations as a function of γ for three different k = 2, 5, and 10 in a sample of n = 1000 genotyped sequences.
Figure 4.—
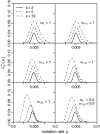
Neutral-likelihood curves for several mutation scenarios. The mutation rate is always μ = 0.005. The distribution of selection coefficients for a particular scenario is specified by the parameters ωγ. The expected counts of mutations to be observed in k of n = 1000 samples,
, were estimated from Equation 14 for each mutation scenario. Likelihoods
were calculated according to Equation 13. The size of the source population was N = 104.
Figure 5.—
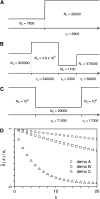
Analysis of the expected errors for three exemplary demographic scenarios. The time arrows in the three scenarios (A–C) go from the past to the present (tips of the arrows). Intervals of constant population size are specified by their respective population sizes Ni and durations τ_i_. Population size changes instantaneously between intervals. Dotted lines specify ancient points in time at which an equilibrium SFS was assumed. The sample size in D was n = 1000.
Figure 6.—
Example of estimated for three different classes of sites. All classes have θ = 1, but selection coefficients differ between classes. For simplicity, all mutations within a class are modeled to have the same selection coefficient.
was then calculated by
. The sample size was n = 1000.
Similar articles
- Population genetics of polymorphism and divergence for diploid selection models with arbitrary dominance.
Williamson S, Fledel-Alon A, Bustamante CD. Williamson S, et al. Genetics. 2004 Sep;168(1):463-75. doi: 10.1534/genetics.103.024745. Genetics. 2004. PMID: 15454557 Free PMC article. - Simultaneous inference of selection and population growth from patterns of variation in the human genome.
Williamson SH, Hernandez R, Fledel-Alon A, Zhu L, Nielsen R, Bustamante CD. Williamson SH, et al. Proc Natl Acad Sci U S A. 2005 May 31;102(22):7882-7. doi: 10.1073/pnas.0502300102. Epub 2005 May 19. Proc Natl Acad Sci U S A. 2005. PMID: 15905331 Free PMC article. - Inference of Distribution of Fitness Effects and Proportion of Adaptive Substitutions from Polymorphism Data.
Tataru P, Mollion M, Glémin S, Bataillon T. Tataru P, et al. Genetics. 2017 Nov;207(3):1103-1119. doi: 10.1534/genetics.117.300323. Epub 2017 Sep 25. Genetics. 2017. PMID: 28951530 Free PMC article. - Using linked markers to infer the age of a mutation.
Rannala B, Bertorelle G. Rannala B, et al. Hum Mutat. 2001 Aug;18(2):87-100. doi: 10.1002/humu.1158. Hum Mutat. 2001. PMID: 11462233 Review. - Nonadaptive processes in primate and human evolution.
Harris EE. Harris EE. Am J Phys Anthropol. 2010;143 Suppl 51:13-45. doi: 10.1002/ajpa.21439. Am J Phys Anthropol. 2010. PMID: 21086525 Review.
Cited by
- Evolutionary Genomics of Sister Species Differing in Effective Population Sizes and Recombination Rates.
Ye Z, Pfrender ME, Lynch M. Ye Z, et al. Genome Biol Evol. 2023 Nov 1;15(11):evad202. doi: 10.1093/gbe/evad202. Genome Biol Evol. 2023. PMID: 37946625 Free PMC article. - Evolutionary Insights from a Large-Scale Survey of Population-Genomic Variation.
Ye Z, Wei W, Pfrender ME, Lynch M. Ye Z, et al. Mol Biol Evol. 2023 Nov 3;40(11):msad233. doi: 10.1093/molbev/msad233. Mol Biol Evol. 2023. PMID: 37863047 Free PMC article. - Evolutionary Insights from a Large-scale Survey of Population-genomic Variation.
Ye Z, Wei W, Pfrender M, Lynch M. Ye Z, et al. bioRxiv [Preprint]. 2023 May 3:2023.05.03.539276. doi: 10.1101/2023.05.03.539276. bioRxiv. 2023. PMID: 37205430 Free PMC article. Updated. Preprint. - Most cancers carry a substantial deleterious load due to Hill-Robertson interference.
Tilk S, Tkachenko S, Curtis C, Petrov DA, McFarland CD. Tilk S, et al. Elife. 2022 Sep 1;11:e67790. doi: 10.7554/eLife.67790. Elife. 2022. PMID: 36047771 Free PMC article. - Evolutionary Genomics of a Subdivided Species.
Maruki T, Ye Z, Lynch M. Maruki T, et al. Mol Biol Evol. 2022 Aug 3;39(8):msac152. doi: 10.1093/molbev/msac152. Mol Biol Evol. 2022. PMID: 35895848 Free PMC article.
References
- Andolfatto, P., 2005. Adaptive evolution of non-coding DNA in Drosophila. Nature 437 1149–1152. - PubMed
- Baer, C. F., M. M. Miyamoto and D. R. Denver, 2007. Mutation rate variation in multicellular eukaryotes: causes and consequences. Nat. Rev. Genet. 8 619–631. - PubMed
Publication types
MeSH terms
LinkOut - more resources
Full Text Sources


