Graded synaptic transmission at the Caenorhabditis elegans neuromuscular junction - PubMed (original) (raw)
Graded synaptic transmission at the Caenorhabditis elegans neuromuscular junction
Qiang Liu et al. Proc Natl Acad Sci U S A. 2009.
Abstract
Most neurotransmission is mediated by action potentials, whereas sensory neurons propagate electrical signals passively and release neurotransmitter in a graded manner. Here, we demonstrate that Caenorhabditis elegans neuromuscular junctions release neurotransmitter in a graded fashion. When motor neurons were depolarized by light-activation of channelrhodopsin-2, the evoked postsynaptic current scaled with the strength of the stimulation. When motor neurons were hyperpolarized by light-activation of halorhodopsin, tonic release of synaptic vesicles was decreased. These data suggest that both evoked and tonic neurotransmitter release is graded in response to membrane potential. Acetylcholine synapses are depressed by high-frequency stimulation, in part due to desensitization of the nicotine-sensitve ACR-16 receptor. By contrast, GABA synapses facilitate before becoming depressed. Graded transmission and plasticity confer a broad dynamic range to these synapses. Graded release precisely transmits stimulation intensity, even hyperpolarizing inputs. Synaptic plasticity alters the balance of excitatory and inhibitory inputs into the muscle in a use-dependent manner.
Conflict of interest statement
The authors declare no conflict of interest.
Figures
Fig. 1.
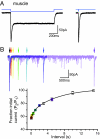
Channelrhodopsin-induced photocurrents in muscle. (A) Photocurrents activated by a 1 s (Left) or 3 ms (Right) light pulse. The downward deflection of the blue line indicates that blue light is on. (B) Paired-pulse analysis of channelrhodopsin recovery from the steady state. (Top) Seven overlaid photocurrent traces activated by pairs of 3-ms light pulses with intervals of 50 ms, 100 ms, 200 ms, 500 ms, 1 s, 2 s, and 5 s. All traces were aligned to the first light pulse (black arrow). The second pulses are indicated by colored arrows. (Bottom) Ratio of the second to the first peak was plotted against paired-pulse intervals. The recovery curve was best fit by a double-exponential function (τfast = 0.6 s ± 0.5, τslow = 6.4 s ± 3.2, n = 6).
Fig. 2.
Light-activated postsynaptic currents. (A) (Left) Acetylcholine postsynaptic current evoked by a 3-ms light pulse (P_unc-17::ChR2::mCherry_). (Middle) Electrically evoked current from the WT. (Right) A 3-ms light pulse failed to evoke postsynaptic response in unc-13(s69) P_unc-17::ChR2::mCherry_. (B) GABA postsynaptic current evoked by a 3-ms light pulse (P_unc-47::ChR2::mCherry_). (C) Comparison of amplitude (Left) and decay time (Right) between light-evoked (gray column, n = 9) and electrically evoked (white column, n = 16) postsynaptic currents. (Electrical: 2.01 nA ± 0.11, τdecay = 5.6 ms ± 0.4; light: 1.96 nA ± 0.18, τdecay = 7.4 ms ± 0.5; *P < 0.01, 2-sample t test). (D) UNC-13 is required for light-evoked postsynaptic currents (0.03 nA ± 0.01, n = 5, **P < 0.00001, 2-sample t test).
Fig. 3.
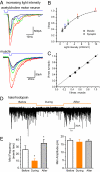
Graded acetylcholine release. (A) Photocurrents from muscle and postsynaptic currents from acetylcholine synapses evoked by blue light at variable intensities (P_unc-17::ChR2::mCherry_). Light intensities (mW/mm2): red, 9.9; orange, 4.9; green, 2.3; blue, 1.4; black, 0.6. (B) Muscle photocurrents (square)) and acetylcholine postsynaptic currents (circle) were normalized to their maximum amplitudes and plotted with light intensity. The normalized muscle and postsynaptic curves each were fitted with a single exponent and overlapped. Color arrows are corresponding to light intensities used in A. (C) Normalized postsynaptic currents are directly proportional to normalized muscle photocurrents. (D) Endogenous acetylcholine release recorded from P_unc-17::Halo::GFP_ before, during, and after illumination. The downward deflection of the yellow line indicates that the yellow light is on. (E) Statistical comparison of mini frequency and amplitude before, during, and after light pulse. Mini frequencies: before (white column), 26.3 ± 5.4; during (yellow column), 10.2 ± 3.1; and after (gray column), 35.3 ± 5.5 (events/s). Mini amplitudes: before, 17.6 pA ± 0.9; during, 16.5 pA ± 1.7; after, 17.1 pA ± 0.9. *P < 0.01, 1-way ANOVA, n = 5.
Fig. 4.
Repetitive stimulation of postsynaptic currents. (A) Acetylcholine currents evoked by 10 Hz (Left), or a 5-s continuous (Right) light pulse in P_unc-17::ChR2::mCherry_. (B) GABA postsynaptic currents evoked by 10 Hz (Left) or a 5-s continuous (Right) light pulse in _Pun_c-47::C_h_R2::mC_h_erry. (C) Recovery of acetylcholine current 10 s after a single light pulse (Left) or after a 5-s train of 10 Hz light pulses (Right). (D) Recovery 10 s after a single light pulse (91.5% ± 2.2%, white column, n = 15) or after a 10-Hz train (52.2% ± 3.2%, gray column, n = 23; *P < 0.00001). (E) Normalized amplitudes (to the first peak amplitude in a 10-Hz train) of evoked acetylcholine currents were plotted with time. Red spheres: light-evoked currents were corrected to the relative muscle photocurrents recorded at 10 Hz (n = 10). Black squares: electrically evoked currents (n = 4). (F) An example of acetylcholine currents electrically evoked by a 10-Hz train from the WT.
Fig. 5.
Synaptic plasticity of acetylcholine and GABA synapses. (A) Corrected light-evoked acetylcholine currents were plotted with time at variable stimulation frequencies. Depression rates at low stimuli frequencies were best fit by single-exponential functions (0.2 Hz: τ = 4.71 s ± 1.24, n = 7; 1 Hz: τ = 0.58 s ± 0.11, n = 9; 5 Hz: τ = 0.09 s ± 0.02, n = 9). Depression rates at high stimuli frequencies were best fit by double-exponential functions (10 Hz: τfast = 0.02 s ± 0.03, τslow = 3.05 s ± 1.84, n = 10; 20 Hz: τfast = 0.02 s ± 0.01, τslow = 2.12 s ± 0.84, n = 13). (B) Corrected light-evoked GABA currents were plotted with time at variable stimulation frequencies. Stimuli at 1 Hz did not cause depression (dark blue line, linear fit, n = 8). Depression caused by 5 Hz light stimuli was best fit by a single-exponential function (τ = 1.13 s ± 0.47, n = 8). Depressions following the initial facilitation at 10 Hz and 20 Hz light stimuli were fit by single-exponential decay (10 Hz: τ = 0.83 s ± 0.14, n = 13; 20 Hz: τ = 0.62 s ± 0.08, n = 9). (C) Exogenous acetylcholine or GABA evoked currents. (D) Corrected light-evoked acetylcholine currents depress differently in unc-38(-) (n = 18) or acr-16(-) animals (n = 14).
Similar articles
- The Anaphase-Promoting Complex (APC) ubiquitin ligase regulates GABA transmission at the C. elegans neuromuscular junction.
Kowalski JR, Dube H, Touroutine D, Rush KM, Goodwin PR, Carozza M, Didier Z, Francis MM, Juo P. Kowalski JR, et al. Mol Cell Neurosci. 2014 Jan;58:62-75. doi: 10.1016/j.mcn.2013.12.001. Epub 2013 Dec 7. Mol Cell Neurosci. 2014. PMID: 24321454 Free PMC article. - The Ror receptor tyrosine kinase CAM-1 is required for ACR-16-mediated synaptic transmission at the C. elegans neuromuscular junction.
Francis MM, Evans SP, Jensen M, Madsen DM, Mancuso J, Norman KR, Maricq AV. Francis MM, et al. Neuron. 2005 May 19;46(4):581-94. doi: 10.1016/j.neuron.2005.04.010. Neuron. 2005. PMID: 15944127 - Neurexin and neuroligin mediate retrograde synaptic inhibition in C. elegans.
Hu Z, Hom S, Kudze T, Tong XJ, Choi S, Aramuni G, Zhang W, Kaplan JM. Hu Z, et al. Science. 2012 Aug 24;337(6097):980-4. doi: 10.1126/science.1224896. Epub 2012 Aug 2. Science. 2012. PMID: 22859820 Free PMC article. - [Changes in the kinetics of quanta secretion-effective mechanism of synaptic transmission modulation].
Bukharaeva ÉA, Nikol'skiĭ EE. Bukharaeva ÉA, et al. Ross Fiziol Zh Im I M Sechenova. 2010 Aug;96(8):766-77. Ross Fiziol Zh Im I M Sechenova. 2010. PMID: 20968062 Review. Russian. - Glutamate at the Vertebrate Neuromuscular Junction: From Modulation to Neurotransmission.
Colombo MN, Francolini M. Colombo MN, et al. Cells. 2019 Aug 28;8(9):996. doi: 10.3390/cells8090996. Cells. 2019. PMID: 31466388 Free PMC article. Review.
Cited by
- Synaptojanin cooperates in vivo with endophilin through an unexpected mechanism.
Dong Y, Gou Y, Li Y, Liu Y, Bai J. Dong Y, et al. Elife. 2015 Apr 28;4:e05660. doi: 10.7554/eLife.05660. Elife. 2015. PMID: 25918845 Free PMC article. - A Neuromechanical Model of Multiple Network Rhythmic Pattern Generators for Forward Locomotion in C. elegans.
Olivares E, Izquierdo EJ, Beer RD. Olivares E, et al. Front Comput Neurosci. 2021 Feb 18;15:572339. doi: 10.3389/fncom.2021.572339. eCollection 2021. Front Comput Neurosci. 2021. PMID: 33679357 Free PMC article. - COMP-1 promotes competitive advantage of nematode sperm.
Hansen JM, Chavez DR, Stanfield GM. Hansen JM, et al. Elife. 2015 Mar 19;4:e05423. doi: 10.7554/eLife.05423. Elife. 2015. PMID: 25789512 Free PMC article. - Functionally asymmetric motor neurons contribute to coordinating locomotion of Caenorhabditis elegans.
Tolstenkov O, Van der Auwera P, Steuer Costa W, Bazhanova O, Gemeinhardt TM, Bergs AC, Gottschalk A. Tolstenkov O, et al. Elife. 2018 Sep 11;7:e34997. doi: 10.7554/eLife.34997. Elife. 2018. PMID: 30204083 Free PMC article. - Rhodopsin-based voltage imaging tools for use in muscles and neurons of Caenorhabditis elegans.
Azimi Hashemi N, Bergs ACF, Schüler C, Scheiwe AR, Steuer Costa W, Bach M, Liewald JF, Gottschalk A. Azimi Hashemi N, et al. Proc Natl Acad Sci U S A. 2019 Aug 20;116(34):17051-17060. doi: 10.1073/pnas.1902443116. Epub 2019 Aug 1. Proc Natl Acad Sci U S A. 2019. PMID: 31371514 Free PMC article.
References
- Katz B, Miledi R. Tetrodotoxin and neuromuscular transmission. Proc R Soc Lond B Biol Sci. 1967;167:8–22. - PubMed
Publication types
MeSH terms
Substances
Grants and funding
- R01 NS034307/NS/NINDS NIH HHS/United States
- R37 NS034307/NS/NINDS NIH HHS/United States
- HHMI/Howard Hughes Medical Institute/United States
- NS034307/NS/NINDS NIH HHS/United States
LinkOut - more resources
Full Text Sources


