A hidden reservoir of integrative elements is the major source of recently acquired foreign genes and ORFans in archaeal and bacterial genomes - PubMed (original) (raw)
A hidden reservoir of integrative elements is the major source of recently acquired foreign genes and ORFans in archaeal and bacterial genomes
Diego Cortez et al. Genome Biol. 2009.
Abstract
Background: Archaeal and bacterial genomes contain a number of genes of foreign origin that arose from recent horizontal gene transfer, but the role of integrative elements (IEs), such as viruses, plasmids, and transposable elements, in this process has not been extensively quantified. Moreover, it is not known whether IEs play an important role in the origin of ORFans (open reading frames without matches in current sequence databases), whose proportion remains stable despite the growing number of complete sequenced genomes.
Results: We have performed a large-scale survey of potential recently acquired IEs in 119 archaeal and bacterial genomes. We developed an accurate in silico Markov model-based strategy to identify clusters of genes that show atypical sequence composition (clusters of atypical genes or CAGs) and are thus likely to be recently integrated foreign elements, including IEs. Our method identified a high number of new CAGs. Probabilistic analysis of gene content indicates that 56% of these new CAGs are likely IEs, whereas only 7% likely originated via horizontal gene transfer from distant cellular sources. Thirty-four percent of CAGs remain unassigned, what may reflect a still poor sampling of IEs associated with bacterial and archaeal diversity. Moreover, our study contributes to the issue of the origin of ORFans, because 39% of these are found inside CAGs, many of which likely represent recently acquired IEs.
Conclusions: Our results strongly indicate that archaeal and bacterial genomes contain an impressive proportion of recently acquired foreign genes (including ORFans) coming from a still largely unexplored reservoir of IEs.
Figures
Figure 1
Markov model-based strategy. (a) An optimal core genes dataset is determined, and (b) a Markov probability matrix is built. (c) For a given genome, each ORF is analyzed using a Markov model that takes into account the Markov probability matrix of the core gene dataset and the composition of the ORF under study. (d) Fore each ORF the model calculates an index that represents the likelihood of that ORF having a composition similar to the core genes dataset. (e) One million random sequences are generated based on the Markov probability matrix of the core genes dataset, and their Markov indexes are calculated. (f) ORFs having a Markov index below a defined threshold of the distribution of random sequence indexes are considered as atypical.
Figure 2
HGT simulations. (a) Eleven core gene datasets for each analyzed genome were determined and, for each genome, 11 Markov models were built based on these different gene datasets. (b) The efficiency of our MM approach, the BM approach, and a GC% approach to detect foreign ORFs was tested by performing in silico HGT simulations using a variety of core gene datasets. (c) For the HTG simulations, 100 genes were chosen from the other 118 genomes and 100 random core ORFs were in silico introduced in the genome under analysis. (d) The average number of these ORFs that were detected as atypical (false positives, expected to be low) was determined. (e) After 100 simulations we searched for the core genes dataset and the cut-off where the average detection of simulated HGT was the highest but the average detection of native core genes was the lowest. (f-h) Average result after 100 HGT simulations for the 119 analyzed genomes using the MM, BM and GC% methods with species-specific core gene datasets and cut-offs. Blue dots represent the average number of true positives detected. Green dots represent the average number of false positives detected. The MM method had a significantly higher rate of detection of true positives than the BM method (Wilcoxon test W = 11,849, _P_-value < 2.2 e-16, means = 86.8 and 74.8 for the MM and BM methods, respectively; and Wilcoxon-test W = 13,824, _P_-value < 2.2 e-16, means = 86.8 and 52.6 for MM and GC%, methods, respectively). No significant differences were found between the MM and BM methods in the detection of false positives (Wilcoxon-test W = 8,359, _P_-value = 0.0311, means = 12.4 and 11.0 for the MM and BM methods, respectively).
Figure 3
Number of identified CAGs, CAG size distribution and proportion of already annotated IEs. (a) Average number and standard deviations of CAGs in the different analyzed groups of Archaea and Bacteria. In red are represented, for each group, the average numbers of annotated IEs. (b) CAGs size distribution.
Figure 4
Proportion of homologues from annotated IEs, newly identified CAGs, and core genes in various databases. Proportion of homologues of ORFs from annotated IEs in the core genes database, the viral database, the plasmid database and the annotated IE database, as well as the proportion of homologues of core genes in the viral database and the plasmid database.
Figure 5
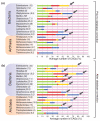
CAGs of likely IE origin based on probabilistic analysis. (a) Proportion of newly identified CAGs of plasmid origin (green) for each analyzed group; proportion of identified CAGs of viral origin (red); proportion of newly identified CAGs of viral/plasmid origin (yellow); proportion of newly identified CAGs of cellular origin (blue); proportion of newly identified CAGs that are unassigned (violet). (b) Same as in (a) but after database correction. Each group's average number of CAGs is indicated in parentheses. Grey arrows indicate the groups with the highest proportions of newly identified CAGs classified as IEs.
Figure 6
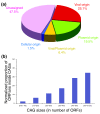
ORFan distribution. (a) Distribution of ORFans in CAGs: ORFans in CAGs of viral origin (red); ORFans in CAGs of plasmid origin (green); ORFans in CAGs of viral/plasmid origin (yellow); ORFans in CAGs of cellular origin (blue); and ORFans in unassigned CAGs (violet). (b) Proportion of ORFans inside CAGs of different sizes. Data were normalized according to the number of CAGs in each category.
Similar articles
- Identification and investigation of ORFans in the viral world.
Yin Y, Fischer D. Yin Y, et al. BMC Genomics. 2008 Jan 19;9:24. doi: 10.1186/1471-2164-9-24. BMC Genomics. 2008. PMID: 18205946 Free PMC article. - On the origin of microbial ORFans: quantifying the strength of the evidence for viral lateral transfer.
Yin Y, Fischer D. Yin Y, et al. BMC Evol Biol. 2006 Aug 16;6:63. doi: 10.1186/1471-2148-6-63. BMC Evol Biol. 2006. PMID: 16914045 Free PMC article. - Improving prokaryotic transposable elements identification using a combination of de novo and profile HMM methods.
Kamoun C, Payen T, Hua-Van A, Filée J. Kamoun C, et al. BMC Genomics. 2013 Oct 11;14:700. doi: 10.1186/1471-2164-14-700. BMC Genomics. 2013. PMID: 24118975 Free PMC article. - CRISPR/Cas, the immune system of bacteria and archaea.
Horvath P, Barrangou R. Horvath P, et al. Science. 2010 Jan 8;327(5962):167-70. doi: 10.1126/science.1179555. Science. 2010. PMID: 20056882 Review. - Status of genome projects for nonpathogenic bacteria and archaea.
Nelson KE, Paulsen IT, Heidelberg JF, Fraser CM. Nelson KE, et al. Nat Biotechnol. 2000 Oct;18(10):1049-54. doi: 10.1038/80235. Nat Biotechnol. 2000. PMID: 11017041 Review.
Cited by
- A novel endonuclease that may be responsible for damaged DNA base repair in Pyrococcus furiosus.
Shiraishi M, Ishino S, Yamagami T, Egashira Y, Kiyonari S, Ishino Y. Shiraishi M, et al. Nucleic Acids Res. 2015 Mar 11;43(5):2853-63. doi: 10.1093/nar/gkv121. Epub 2015 Feb 18. Nucleic Acids Res. 2015. PMID: 25694513 Free PMC article. - Population diversity of ORFan genes in Escherichia coli.
Yu G, Stoltzfus A. Yu G, et al. Genome Biol Evol. 2012;4(11):1176-87. doi: 10.1093/gbe/evs081. Genome Biol Evol. 2012. PMID: 23034216 Free PMC article. - The mosaicism of plasmids revealed by atypical genes detection and analysis.
Bosi E, Fani R, Fondi M. Bosi E, et al. BMC Genomics. 2011 Aug 8;12:403. doi: 10.1186/1471-2164-12-403. BMC Genomics. 2011. PMID: 21824433 Free PMC article. - The virocell concept and environmental microbiology.
Forterre P. Forterre P. ISME J. 2013 Feb;7(2):233-6. doi: 10.1038/ismej.2012.110. Epub 2012 Oct 4. ISME J. 2013. PMID: 23038175 Free PMC article. No abstract available. - Inevitability of Genetic Parasites.
Iranzo J, Puigbò P, Lobkovsky AE, Wolf YI, Koonin EV. Iranzo J, et al. Genome Biol Evol. 2016 Sep 26;8(9):2856-2869. doi: 10.1093/gbe/evw193. Genome Biol Evol. 2016. PMID: 27503291 Free PMC article.
References
- Gogarten JP, Townsend JP. Horizontal gene transfer, genome innovation and evolution. Nat Rev Microbiol. 2005;3:679–687. - PubMed
- Canchaya C, Fournous G, Chibani-Chennoufi S, Dillmann ML, Brussow H. Phage as agents of lateral gene transfer. Curr Opin Microbiol. 2003;6:417–424. - PubMed
- Frost LS, Leplae R, Summers AO, Toussaint A. Mobile genetic elements: the agents of open source evolution. Nat Rev Microbiol. 2005;3:722–732. - PubMed
- Canchaya C, Fournous G, Brussow H. The impact of prophages on bacterial chromosomes. Mol Microbiol. 2004;53:9–18. - PubMed
- Karlin S. Detecting anomalous gene clusters and pathogenicity islands in diverse bacterial genomes. Trends Microbiol. 2001;9:335–343. - PubMed
Publication types
MeSH terms
LinkOut - more resources
Full Text Sources
Other Literature Sources


