The Hippo tumor-suppressor pathway regulates apical-domain size in parallel to tissue growth - PubMed (original) (raw)
. 2009 Jul 15;122(Pt 14):2351-9.
doi: 10.1242/jcs.046482. Epub 2009 Jun 16.
Affiliations
- PMID: 19531584
- PMCID: PMC2704875
- DOI: 10.1242/jcs.046482
The Hippo tumor-suppressor pathway regulates apical-domain size in parallel to tissue growth
Fisun Hamaratoglu et al. J Cell Sci. 2009.
Abstract
The Hippo tumor-suppressor pathway controls tissue growth in Drosophila and mammals by regulating cell proliferation and apoptosis. The Hippo pathway includes the Fat cadherin, a transmembrane protein, which acts upstream of several other components that form a kinase cascade that culminates in the regulation of gene expression through the transcriptional coactivator Yorkie (Yki). Our previous work in Drosophila indicated that Merlin (Mer) and Expanded (Ex) are members of the Hippo pathway and act upstream of the Hippo kinase. In contrast to this model, it was suggested that Mer and Ex primarily regulate membrane dynamics and receptor trafficking, thereby affecting Hippo pathway activity only indirectly. Here, we examined the effects of Mer, Ex and the Hippo pathway on the size of the apical membrane and on apical-basal polarity complexes. We found that mer;ex double mutant imaginal disc cells have significantly increased levels of apical membrane determinants, such as Crb, aPKC and Patj. These phenotypes were shared with mutations in other Hippo pathway components and required Yki, indicating that Mer and Ex signal through the Hippo pathway. Interestingly, however, whereas Crb was required for the accumulation of other apical proteins and for the expansion of the apical domain observed in Hippo pathway mutants, its elimination did not significantly reverse the overgrowth phenotype of warts mutant cells. Therefore, Hippo signaling regulates cell polarity complexes in addition to and independently of its growth control function in imaginal disc cells.
Figures
Fig. 1.
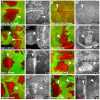
Merlin and Expanded signaling requires Yorkie. (A) Third instar eye imaginal disc containing mer;ex mutant clones marked by the absence of GFP expression (in green). Mutant clones had elevated membrane levels of DER (red in A, grayscale in A′) behind the morphogenetic furrow. Arrowheads point to clone borders in these and all subsequent panels. (B)mer;ex mutant clones in a wing disc showed elevated levels of Ft. (C,D) wts mutant clones in an eye (C) and a wing (D) disc accumulated Ft at the membrane. (E) mer;ex,yki triple mutant clones did not upregulate DER in an eye disc. (F) yki; wts double mutant clones did not upregulate Ft in a wing disc. Anterior is to the left and dorsal is up for all discs. Scale bars: 50 μm.
Fig. 2.
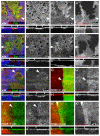
Hippo signaling regulates the levels of the apical membrane complex proteins aPKC, Crb and Patj in eye and wing discs. (A) Third instar wing discs containing mer;ex mutant clones marked by the absence of GFP expression (green) had increased membrane levels of aPKC (red in A and grayscale in A′). (B) mer;ex,yki triple mutant clones marked by the absence of Ex expression (green in B) had normal levels of aPKC (red in B and grayscale in B′). (C-H) mer;ex or hpo mutant clones had elevated levels of aPKC (C,D), Crb (E) and Patj (F-H) (red in overlay channels, grayscale in C′, D′,E′, F′, G′ and H′) in wing (D,F,G) and eye (C,E,H) discs. Anterior is to the left and dorsal is up for all discs. Scale bars: 50 μm.
Fig. 3.
The regulation of apical complexes is a specific downstream effect of the Hippo pathway. (A,B) Tsc1 mutant clones marked by the absence of GFP expression (green in A and B) had normal levels of aPKC and Patj (red in A, B and grayscale in A′, B′) in eye (A) and wing (B) discs. (C-F) aPKC levels (red in the overlay channels, grayscale in C′, D′,E′ and F′) were not affected in wing discs overexpressing Myc (C), CycD and Cdk4 (D), the bantam miRNA (E), or CycE and DIAP1 (F) in their posterior compartments under the control of hh-Gal4. Anterior compartments are marked with Ci labeling (green in C, D, E and F). Anterior is to the left and dorsal is up for all discs. Arrowheads point to anterior-posterior compartment boundaries. Scale bars: 100 μm.
Fig. 4.
Accumulation of apical complexes in warts mutant cells leads to apical domain expansion. (A-F) Third instar wing imaginal discs containing_wts_ mutant clones marked by the absence of β-gal expression (blue in A-F and gray in A′″-D′″). Discs were stained for the apical markers Patj (green in A,B and grey in A″,B″) and Sas (green in C,D, red in E,F and grey in C″,D″), the basolateral marker Dlg (red in A-D and grey in A′-D′), and the adherens junction marker E-cad (green in E,F and grey in E′,F′). (G-K) Crb (red in G,H and green in G′,H′) and aPKC levels (green in I-L and grey in I′-L′) were elevated in wing discs overexpressing Yki (G-J) and Crb (K,L) in their posterior compartments under the control of_hh-Gal4._ Posterior compartments are marked by coexpression of GFP (green in G,H). Anterior compartments are marked by Ci labeling (red in I-L). (B,D,F,H,J,L) Optical sections are shown through the wing pouch of the corresponding discs above them. Arrowheads mark clone borders. Scale bars: 50 μm.
Fig. 5.
Crb is required for aPKC and Patj localization. (A-C) Crb, (D-F) aPKC, and (G-I) Patj expression in wts (left), crb (middle), and_wts,crb_ (right) double mutant clones in wing (A-F) and eye (G-I) discs. Crb, aPKC and Patj levels were elevated in wts mutant clones, but the levels of Patj and aPKC in membranes were strongly reduced in_crb_ and wts,crb mutant clones. Crb was lost in crb and wts,crb mutant clones as expected. Clones are marked by the absence of GFP expression (green) and Crb, aPKC, and Patj stainings are shown in red in the composite images and in grayscale to their right. Anterior is to the left and dorsal is up for all discs. Scale bars: 50 μm.
Fig. 6.
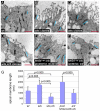
Crb is required for the apical hypertrophy of wts mutant cells. (A-F) Representative transmission electron micrographs of third instar wing imaginal discs from a wild-type larva (A), larvae containing wts (B and C) or wts,crb mutant clones (D), a disc overexpressing Crb in its posterior compartment under the control of a hh-Gal4 driver (E), and the anterior wild-type half of the same disc (F). Blue bars indicate the position and size of adherens junctions. Red scale bars: 500 nm. (G) Average apical domain lengths for the different genotypes shown in A-F. _P_-values (as measured using the Student's _t_-test) between some of the genotypes are indicated. Values represent the means ± s.e.m. of 20-30 samples.
Fig. 7.
Crb is not required for warts mutant overgrowth phenotypes. (A-D) Eye imaginal discs from third instar larvae containing wt (A),wts (B), crb (C), and wts,crb (D) mutant clones that are marked by the absence of GFP expression (gray). Clones were induced using eyFLP. (E-H) Wing imaginal discs from third instar larvae containing wt (E), wts (F), crb (G) and_wts,crb_ (H) mutant clones marked by the absence of GFP expression (gray). Clones were induced using ubxFLP. Anterior is to the left and dorsal is up for all discs. Scale bars: 200 μm.
Fig. 8.
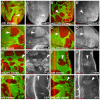
Crb is not required for Hippo target gene upregulation or receptor accumulation in warts mutant cells. (A,B) Eye imaginal discs containing crb and wts,crb double mutant clones marked by lack of GFP expression (green in A and B) stained for DIAP1 expression (red in A and B and grayscale in A′ and B′). (C,D) Wing imaginal discs containing wts and wts,crb double mutant clones marked by lack of GFP expression (green in C and D) stained for β-gal to detect the expression of an enhancer trap reporter insertion into the ex gene (red in C and D and grayscale in C′ and D′). (E-H) wts (F) or wts,crb double (E and H) mutant clones marked by lack of GFP expression (green in E, F and H) upregulate Fat and DER (red in E, F and H, grayscale in E′, F′ and H′). (G) Lack of Crb (marked by GFP expression in green) does not affect DER expression (red in G, grayscale in G′). Scale bars: 50 μm.
Similar articles
- The Hippo pathway regulates apical-domain size independently of its growth-control function.
Genevet A, Polesello C, Blight K, Robertson F, Collinson LM, Pichaud F, Tapon N. Genevet A, et al. J Cell Sci. 2009 Jul 15;122(Pt 14):2360-70. doi: 10.1242/jcs.041806. Epub 2009 Jun 16. J Cell Sci. 2009. PMID: 19531586 Free PMC article. - Loss of the Drosophila cell polarity regulator Scribbled promotes epithelial tissue overgrowth and cooperation with oncogenic Ras-Raf through impaired Hippo pathway signaling.
Doggett K, Grusche FA, Richardson HE, Brumby AM. Doggett K, et al. BMC Dev Biol. 2011 Sep 29;11:57. doi: 10.1186/1471-213X-11-57. BMC Dev Biol. 2011. PMID: 21955824 Free PMC article. - The fat cadherin acts through the hippo tumor-suppressor pathway to regulate tissue size.
Willecke M, Hamaratoglu F, Kango-Singh M, Udan R, Chen CL, Tao C, Zhang X, Halder G. Willecke M, et al. Curr Biol. 2006 Nov 7;16(21):2090-100. doi: 10.1016/j.cub.2006.09.005. Epub 2006 Sep 21. Curr Biol. 2006. PMID: 16996265 - Lgl/aPKC and Crb regulate the Salvador/Warts/Hippo pathway.
Parsons LM, Grzeschik NA, Allott ML, Richardson HE. Parsons LM, et al. Fly (Austin). 2010 Oct-Dec;4(4):288-93. doi: 10.4161/fly.4.4.13116. Epub 2010 Oct 21. Fly (Austin). 2010. PMID: 20798605 Free PMC article. Review. - Upstream paths for Hippo signaling in Drosophila organ development.
Choi KW. Choi KW. BMB Rep. 2018 Mar;51(3):134-142. doi: 10.5483/bmbrep.2018.51.3.027. BMB Rep. 2018. PMID: 29397870 Free PMC article. Review.
Cited by
- Merlin: a tumour suppressor with functions at the cell cortex and in the nucleus.
Li W, Cooper J, Karajannis MA, Giancotti FG. Li W, et al. EMBO Rep. 2012 Mar;13(3):204-15. doi: 10.1038/embor.2012.11. EMBO Rep. 2012. PMID: 22482125 Free PMC article. Review. - Myotubularin functions through actomyosin to interact with the Hippo pathway.
Hu L, Brichalli W, Li N, Chen S, Cheng Y, Liu Q, Xiong Y, Yu J. Hu L, et al. EMBO Rep. 2022 Dec 6;23(12):e55851. doi: 10.15252/embr.202255851. Epub 2022 Oct 26. EMBO Rep. 2022. PMID: 36285521 Free PMC article. - Nf2/Merlin controls progenitor homeostasis and tumorigenesis in the liver.
Benhamouche S, Curto M, Saotome I, Gladden AB, Liu CH, Giovannini M, McClatchey AI. Benhamouche S, et al. Genes Dev. 2010 Aug 15;24(16):1718-30. doi: 10.1101/gad.1938710. Epub 2010 Jul 30. Genes Dev. 2010. PMID: 20675406 Free PMC article. - Signal integration in TGF-β, WNT, and Hippo pathways.
Attisano L, Wrana JL. Attisano L, et al. F1000Prime Rep. 2013 Jun 3;5:17. doi: 10.12703/P5-17. Print 2013. F1000Prime Rep. 2013. PMID: 23755364 Free PMC article. - Cell Junctions in Hippo Signaling.
Karaman R, Halder G. Karaman R, et al. Cold Spring Harb Perspect Biol. 2018 May 1;10(5):a028753. doi: 10.1101/cshperspect.a028753. Cold Spring Harb Perspect Biol. 2018. PMID: 28600393 Free PMC article. Review.
References
- Assemat, E., Bazellieres, E., Pallesi-Pocachard, E., Le Bivic, A. and Massey-Harroche, D. (2008). Polarity complex proteins. Biochim. Biophys. Acta 1778, 614-630. - PubMed
- Bennett, F. C. and Harvey, K. F. (2006). Fat cadherin modulates organ size in Drosophila via the Salvador/Warts/Hippo signaling pathway. Curr. Biol. 16, 2101-2110. - PubMed
- Bilder, D., Schober, M. and Perrimon, N. (2003). Integrated activity of PDZ protein complexes regulates epithelial polarity. Nat. Cell Biol. 5, 53-58. - PubMed
- Brand, A. H. and Perrimon, N. (1993). Targeted gene expression as a means of altering cell fates and generating dominant phenotypes. Development 118, 401-415. - PubMed
- Cho, E. and Irvine, K. D. (2004). Action of fat, four-jointed, dachsous and dachs in distal-to-proximal wing signaling. Development 131, 4489-4500. - PubMed
Publication types
MeSH terms
Substances
LinkOut - more resources
Full Text Sources
Molecular Biology Databases
Miscellaneous


