The phospho-dependent dynamin-syndapin interaction triggers activity-dependent bulk endocytosis of synaptic vesicles - PubMed (original) (raw)
The phospho-dependent dynamin-syndapin interaction triggers activity-dependent bulk endocytosis of synaptic vesicles
Emma L Clayton et al. J Neurosci. 2009.
Abstract
Synaptic vesicles (SVs) are retrieved by more than one mode in central nerve terminals. During mild stimulation, the dominant SV retrieval pathway is classical clathrin-mediated endocytosis (CME). During elevated neuronal activity, activity-dependent bulk endocytosis (ADBE) predominates, which requires activation of the calcium-dependent protein phosphatase calcineurin. We now report that calcineurin dephosphorylates dynamin I in nerve terminals only above the same activity threshold that triggers ADBE. ADBE was arrested when the two major phospho-sites on dynamin I were perturbed, suggesting that dynamin I dephosphorylation is a key step in its activation. Dynamin I dephosphorylation stimulates a specific dynamin I-syndapin I interaction. Inhibition of this interaction by competitive peptides or by site-directed mutagenesis exclusively inhibited ADBE but did not affect CME. The results reveal that the phospho-dependent dynamin-syndapin interaction recruits ADBE to massively increase SV endocytosis under conditions of elevated neuronal activity.
Figures
Figure 1.
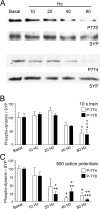
A–C, Dynamin I is dephosphorylated in an activity-dependent manner. Granule neuron cultures were subjected to action potential trains of increasing frequency (10, 20, 40, or 80 Hz) with either a fixed duration (10 s) (B) or a fixed number (800 action potentials) (C). The extent of phosphorylation on either residue Ser-774 (open bars) or Ser-778 (solid bars) was assessed by Western blotting with phospho-specific antibodies. Synaptophysin (SYP) blots were performed as loading controls. A shows typical Western blots for phospho-dynamin I (P-778, P-774) and SYP. Results presented in B and C for phospho-dynamin I are corrected for protein level (SYP), and are normalized to control ± SEM (10 s: P774, n = 4; P778, n = 3; 800 action potentials: P774, n = 3; P778, n = 4). One-way ANOVA; *p < 0.05, **p < 0.01, ***p < 0.001 to Ctrl; +p < 0.05, ++p < 0.01, 10 Hz; ∧p < 0.05, 20 Hz.
Figure 2.
Dynamin I dephosphorylation is required for FM1-43, but not FM2-10 uptake. A, Granule neuron cultures were loaded and unloaded with FM dyes using the protocol displayed. Dyes were loaded with 800 action potentials (80 Hz) and then washed away immediately. Dye unloading was stimulated by a 30 s stimulus of 50 m
m
KCl. B, Left panels display transfected neurons (either DynIdmA-mCer or DynIdmE-mCer), middle panels display FM1-43 loading, and right panels display a merged image of transfected neurons (green) and FM1-43 loading (red). Arrows indicate nerve terminals. C, D, Time course of FM1-43 unloading from either transfected (gray) or nontransfected (black) nerve terminals in the same field of view (C, DynIdmE-mCer; or D, DynIdmA-mCer). E, Bar graph displays the extent of FM1-43 loading of transfected nerve terminals as a percentage of untransfected nerve terminals in the same field of view (ΔS1 ± SEM; DynIWT-mCer, n = 3; DynIdmE-mCer and DynIdmA-mCer, n = 4). F, Left panels display transfected neurons (either DynIdmA-mCer or DynIdmE-mCer), middle panels display FM2-10 loading, and right panels display a merged image of transfected neurons (green) and FM2-10 loading (red). Arrows indicate nerve terminals. G, H, Time course of FM2-10 unloading from either transfected (gray) or nontransfected (black) nerve terminals in the same field of view (G, DynIdmE-mCer; or H, DynIdmA-mCer). I, Bar graph displays the extent of FM2-10 loading of transfected nerve terminals as a percentage of untransfected nerve terminals in the same field of view (ΔS1 ± SEM; DynIWT-mCer, n = 3; DynIdmE-mCer, n = 4; DynIdmA-mCer, n = 5). One-way ANOVA: *p < 0.05, **p < 0.01.
Figure 3.
The dynamin–syndapin interaction is required for FM1-43 but not FM2-10 uptake. A, Granule neuron cultures were loaded and unloaded with FM dyes using the protocol displayed. Dyes were loaded with 800 action potentials (80 Hz) and then washed away immediately. Dye unloading was stimulated by a 30 s stimulus of 50 m
m
KCl. B, C, Left panels display transfected neurons (DynIPB2-mCer), middle panels display either FM1-43 (B) or FM2-10 (C) loading, and right panels display a merged image of transfected neurons (green) and FM1-43 loading (red). Arrows indicate nerve terminals. D, E, Time course of either FM1-43 (D) or FM2-10 (E) unloading from either transfected (gray) or nontransfected (black) nerve terminals in the same field of view is displayed. Bar graph displays the extent of either FM1-43 (black bars) or FM2-10 (open bars) loading of transfected nerve terminals (PB2) compared with untransfected nerve terminals (Ctrl) in the same field of view (ΔS1 ± SEM; FM1-43, n = 3; FM2-10, n = 4). Student's t test, *p < 0.05.
Figure 4.
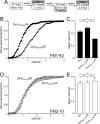
Dynamin I phospho-deficient peptide, but not phospho-mimetic peptides, block FM1-43 uptake. A, Granule neuron cultures were loaded and unloaded with FM dyes using the protocol displayed. Dyes were loaded at both S1 and S2 with 800 action potentials (80 Hz) and then washed away immediately. At S2, cultures were preincubated with 30 μ
m
peptide (either DynI769–784AA or DynI769–784EE) for 15 min before loading. At both S1 and S2, unloading was stimulated by two 30 s stimuli of 50 m
m
KCl. B, D, Cumulative histograms of the effect of peptide on either FM1-43 (B) or FM2-10 (D) unloading in individual nerve terminals (ΔS2/ΔS1) are displayed (circles represent DynI769–784AA, whereas triangles represent DynI769–784EE). Bar graphs in C and E display the mean ΔS2/ΔS1 response ± SEM in the absence (Ctrl) or presence of the peptides (all n = 3 ± SEM except FM1-43 Ctrl, n = 4). One-way ANOVA; *p < 0.05, ***p < 0.001.
Figure 5.
Dynamin I phospho-deficient or phospho-mimetic peptides do not block FM1-43 uptake during mild neuronal activity. A, Granule neuron cultures were loaded and unloaded with FM1-43 using the protocol displayed. Dyes were loaded at both S1 and S2 with 200 action potentials (10 Hz) and then washed away immediately. At S2, cultures were preincubated with 30 μ
m
peptide (either DynI769–784AA or DynI769–784EE) for 15 min before loading. At both S1 and S2, unloading was stimulated by two trains of 400 action potentials (40 Hz). B, A cumulative histogram of the effect of peptide on FM1-43 unloading in individual nerve terminals (ΔS2/ΔS1) is displayed (circles represent DynI769–784AA whereas triangles represent DynI769–784EE). C, The bar graph displays the mean ΔS2/ΔS1 response ± SEM in the absence (Ctrl) or presence of the peptides (all n = 3 ± SEM). One-way ANOVA was performed.
Figure 6.
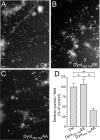
Dynamin I phospho-deficient peptide, but not phospho-mimetic peptide, blocks the uptake of large dextrans. Granule neuron cultures were incubated with 50 μ
m
tetramethylrhodamine-dextran and loading was stimulated by a train of 800 action potentials (80 Hz) followed by immediate dextran washout. Where indicated, cultures were incubated with 30 μ
m
dynamin peptides 15 min before and during stimulation (either DynI769–784AA or DynI769–784EE). A–C, Panels show dextran loading in typical fields of view either in the absence of peptide (Ctrl) (A) or in the presence of either DynI769–784EE (B) or DynI769–784AA (C). Scale bar represents 15 μm in all images. D, The mean number of dextran puncta per field of view as a percentage of control is displayed (all n = 3 ± SEM, **p < 0.01, one-way ANOVA).
Figure 7.
Dynamin I phospho-deficient peptide blocks HRP uptake into endosomes but not SVs. Granule neuron cultures were incubated with HRP and its loading was stimulated by a 2 min stimulus of 50 m
m
KCl. Where indicated, cultures were incubated with 30 μ
m
dynamin I peptides 15 min before and during stimulation (either DynI769–784AA or DynI769–784EE). A–C, Panels show HRP-labeled structures in typical fields of view either in the absence of peptide (A) or in the presence of either DynI769–784EE (B) or DynI769–784AA (C). Scale bar represents 150 nm in all images. D, E, Mean number of either HRP-labeled (solid bars) or clear (open bars) endosomes (D) or SVs (E) per nerve terminal is displayed either in the absence (Ctrl) or presence of peptides (Ctrl, n = 44 nerve terminals; DynI769–784EE, n = 31; DynI769–784AA, n = 23; all ± SEM, **p < 0.01, *p < 0.05, one-way ANOVA).
Figure 8.
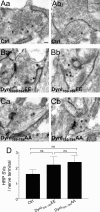
Dynamin I phospho-deficient peptide does not block HRP uptake into SVs during mild neuronal activity. Granule neuron cultures were incubated with HRP and loading was stimulated by a 20 s stimulus of 200 action potentials (10 Hz). Where indicated, cultures were incubated with 30 μ
m
dynamin I peptide (either DynI769–784AA or DynI769–784EE) 15 min before and during stimulation. A–C, Panels show HRP-labeled structures in typical fields of view either in the absence of peptide (Aa, Ab) or in the presence of either DynI769–784EE (Ba, Bb) or DynI769–784AA (Ca, Cb). Scale bar represents 250 nm in all images. D, Mean number of HRP-labeled SVs per nerve terminal is displayed either in the absence (Ctrl) or presence of peptides (Ctrl, n = 49 nerve terminals; DynI769–784EE, n = 14; DynI769–784AA, n = 23; all ± SEM, one-way ANOVA).
Figure 9.
Dynamin GTPase activity is required for ADBE. Granule neuron cultures were incubated with 50 μ
m
tetramethylrhodamine-dextran and loading was stimulated by a train of 800 action potentials (80 Hz) followed by immediate dextran washout. Cultures were incubated with or without 80 μ
m
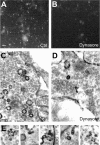
dynasore for 15 min before and during stimulation. A–D, Panels show dextran loading in typical fields of view either in the absence (Ctrl) (A) or presence (B) of dynasore. Scale bar represents 15 μm in all images. C, D, Cultures were incubated with HRP and its loading was stimulated with 800 action potentials (80 Hz) followed by immediate HRP washout and fixation. Cultures were incubated with or without 80 μ
m
dynasore 15 min before and during stimulation. C–E, Panels show HRP-labeled structures in typical fields of view either in the absence (Ctrl) (C) or presence (D) of dynasore. E, Representative images of malformed HRP-labeled endosomes in the presence of dynasore. Scale bar: (C, D), 150 nm; (E), 100 nm.
Figure 10.
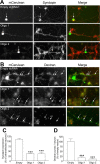
Silencing syndapin I expression inhibits ADBE. A, Granule neuron cultures were cotransfected with mCerulean and either shRNA against syndapin or empty shRNA vector. After 72 h, syndapin expression was quantified using immunofluorescence. Left panels show transfected neurons with empty shRNA vector, Oligo 1, or Oligo 2. Middle panels show syndapin expression. Right panels show a merged image with transfected neuron in green and syndapin in red. Arrows highlight syndapin expression levels in transfected neurons. B, Granule neuron cultures were transfected as in A and then incubated with 50 μ
m
tetramethylrhodamine-dextran. Dextran internalization was stimulated by a train of 800 action potentials (80 Hz) followed by immediate washout. Left panels show transfected neurons with empty shRNA vector, Oligo 1, or Oligo 2. Middle panels show dextran uptake. Right panels show a merged image with transfected neuron in green and dextran in red. Arrows highlight dextran uptake in transfected neurons. Note the dextran puncta in neurons transfected with empty vector, compared with the absence of puncta in either Oligo 1- or Oligo 2-transfected neurons. C, Quantification of syndapin knockdown in the cell body of shRNA-expressing neurons. (All n = 3 experiments ± SEM; ***p < 0.001, one-way ANOVA.) D, Quantification of the effect of syndapin knockdown on dextran uptake in shRNA-expressing neurons. Results are expressed as dextran puncta per neuron, as a percentage of control (empty vector, n = 3 experiments; Oligo 1 and Oligo 2, n = 4; all ± SEM, ***p < 0.001, one-way ANOVA).
Figure 11.
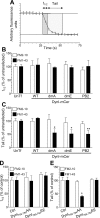
Inhibition of ADBE eliminates a sustained phase of SV exocytosis. A, Two parameters were monitored with respect to dye unloading, the time for nerve terminals to lose 50% of their dye content (_t_1/2, shown in dark gray) and the time for the remainder to be unloaded (Tail, shown in light gray). In all experiments, dye was loaded with 800 action potentials (80 Hz) and washed away immediately after stimulation. Dye was unloaded with 50 m
m
KCl. B, C, Effect of overexpression of DynIWT-mCer (WT) DynIdmA-mCer (dmA), DynIdmE-mCer (dmE), or DynIPB2-mCer (PB2) on either the _t_1/2 (B) or tail (C) unloading kinetics of both FM2-10 (open bars) and FM1-43 (closed bars). Results are expressed as a percentage of untransfected neurons (FM1-43: DynIWT-mCer, n = 3; DynIdmE-mCer, n = 4; DynIdmA-mCer, n = 5, DynIPB2-mCer, n = 3; FM2-10: DynIWT-mCer, n = 3; DynIdmE-mCer, n = 4; DynIdmA-mCer, n = 5, DynIPB2-mCer, n = 4 ± SEM; one-way ANOVA, *p < 0.05, **p < 0.01). D, E, Effect of DynI769–784AA or DynI769–784EE peptides on either the _t_1/2 (D) or tail (E) unloading kinetics of both FM2-10 (open bars) and FM1-43 (closed bars). Results are expressed as a percentage of control neurons [all n = 3 ± SEM except FM1-43 control (n = 4)]. One-way ANOVA, *p < 0.05.
Similar articles
- Activity-dependent bulk endocytosis and clathrin-dependent endocytosis replenish specific synaptic vesicle pools in central nerve terminals.
Cheung G, Jupp OJ, Cousin MA. Cheung G, et al. J Neurosci. 2010 Jun 16;30(24):8151-61. doi: 10.1523/JNEUROSCI.0293-10.2010. J Neurosci. 2010. PMID: 20554865 Free PMC article. - Syndapin I is the phosphorylation-regulated dynamin I partner in synaptic vesicle endocytosis.
Anggono V, Smillie KJ, Graham ME, Valova VA, Cousin MA, Robinson PJ. Anggono V, et al. Nat Neurosci. 2006 Jun;9(6):752-60. doi: 10.1038/nn1695. Epub 2006 Apr 30. Nat Neurosci. 2006. PMID: 16648848 Free PMC article. - Synaptic vesicle generation from activity-dependent bulk endosomes requires a dephosphorylation-dependent dynamin-syndapin interaction.
Cheung G, Cousin MA. Cheung G, et al. J Neurochem. 2019 Dec;151(5):570-583. doi: 10.1111/jnc.14862. Epub 2019 Oct 17. J Neurochem. 2019. PMID: 31479508 Free PMC article. - The molecular physiology of activity-dependent bulk endocytosis of synaptic vesicles.
Clayton EL, Cousin MA. Clayton EL, et al. J Neurochem. 2009 Nov;111(4):901-14. doi: 10.1111/j.1471-4159.2009.06384.x. Epub 2009 Sep 16. J Neurochem. 2009. PMID: 19765184 Free PMC article. Review. - Dynamin I phosphorylation and the control of synaptic vesicle endocytosis.
Smillie KJ, Cousin MA. Smillie KJ, et al. Biochem Soc Symp. 2005;(72):87-97. doi: 10.1042/bss0720087. Biochem Soc Symp. 2005. PMID: 15649133 Free PMC article. Review.
Cited by
- Phosphatidylinositol 3-Kinase Couples Localised Calcium Influx to Activation of Akt in Central Nerve Terminals.
Nicholson-Fish JC, Cousin MA, Smillie KJ. Nicholson-Fish JC, et al. Neurochem Res. 2016 Mar;41(3):534-43. doi: 10.1007/s11064-015-1663-5. Epub 2015 Jul 22. Neurochem Res. 2016. PMID: 26198194 Free PMC article. - Syndapin/SDPN-1 is required for endocytic recycling and endosomal actin association in the C. elegans intestine.
Gleason AM, Nguyen KC, Hall DH, Grant BD. Gleason AM, et al. Mol Biol Cell. 2016 Sep 14;27(23):3746-56. doi: 10.1091/mbc.E16-02-0116. Online ahead of print. Mol Biol Cell. 2016. PMID: 27630264 Free PMC article. - Bulk-like endocytosis plays an important role in the recycling of insulin granules in pancreatic beta cells.
Wen D, Xue Y, Liang K, Yuan T, Lu J, Zhao W, Xu T, Chen L. Wen D, et al. Protein Cell. 2012 Aug;3(8):618-26. doi: 10.1007/s13238-012-2938-0. Epub 2012 Jun 22. Protein Cell. 2012. PMID: 22729398 Free PMC article. - Control of neuronal ion channel function by glycogen synthase kinase-3: new prospective for an old kinase.
Wildburger NC, Laezza F. Wildburger NC, et al. Front Mol Neurosci. 2012 Jul 16;5:80. doi: 10.3389/fnmol.2012.00080. eCollection 2012. Front Mol Neurosci. 2012. PMID: 22811658 Free PMC article. - Activity-dependent bulk endocytosis and clathrin-dependent endocytosis replenish specific synaptic vesicle pools in central nerve terminals.
Cheung G, Jupp OJ, Cousin MA. Cheung G, et al. J Neurosci. 2010 Jun 16;30(24):8151-61. doi: 10.1523/JNEUROSCI.0293-10.2010. J Neurosci. 2010. PMID: 20554865 Free PMC article.
References
- Anggono V, Robinson PJ. Syndapin I and endophilin I bind overlapping proline-rich regions of dynamin I: role in synaptic vesicle endocytosis. J Neurochem. 2007;102:931–943. - PubMed
Publication types
MeSH terms
Substances
LinkOut - more resources
Full Text Sources
Other Literature Sources
