NAADP-mediated Ca2+ signaling via type 1 ryanodine receptor in T cells revealed by a synthetic NAADP antagonist - PubMed (original) (raw)
. 2009 Jun 30;106(26):10678-83.
doi: 10.1073/pnas.0809997106. Epub 2009 Jun 16.
Bo Zhang, Merle Nebel, Chiara Cordiglieri, Francesca Odoardi, Tanja Kirchberger, Naoto Kawakami, James Dowden, Frederike Schmid, Klaus Dornmair, Martin Hohenegger, Alexander Flügel, Andreas H Guse, Barry V L Potter
Affiliations
- PMID: 19541638
- PMCID: PMC2697110
- DOI: 10.1073/pnas.0809997106
NAADP-mediated Ca2+ signaling via type 1 ryanodine receptor in T cells revealed by a synthetic NAADP antagonist
Werner Dammermann et al. Proc Natl Acad Sci U S A. 2009.
Abstract
The nucleotide NAADP was recently discovered as a second messenger involved in the initiation and propagation of Ca(2+) signaling in lymphoma T cells, but its impact on primary T cell function is still unknown. An optimized, synthetic, small molecule inhibitor of NAADP action, termed BZ194, was designed and synthesized. BZ194 neither interfered with Ca(2+) mobilization by d-myo-inositol 1,4,5-trisphosphate or cyclic ADP-ribose nor with capacitative Ca(2+) entry. BZ194 specifically and effectively blocked NAADP-stimulated [(3)H]ryanodine binding to the purified type 1 ryanodine receptor. Further, in intact T cells, Ca(2+) mobilization evoked by NAADP or by formation of the immunological synapse between primary effector T cells and astrocytes was inhibited by BZ194. Downstream events of Ca(2+) mobilization, such as nuclear translocation of "nuclear factor of activated T cells" (NFAT), T cell receptor-driven interleukin-2 production, and proliferation in antigen-experienced CD4(+) effector T cells, were attenuated by the NAADP antagonist. Taken together, specific inhibition of the NAADP signaling pathway constitutes a way to specifically and effectively modulate T-cell activation and has potential in the therapy of autoimmune diseases.
Conflict of interest statement
The authors declare no conflict of interest.
Figures
Fig. 1.
Nicotinic acid and its derivative BZ194 inhibit NAADP-mediated Ca2+ signaling in T cells. (A) Structures of NAADP and NADP. (B) NAADP-induced Ca2+ signaling in T cells is inhibited by nicotinic acid. Jurkat T cells were loaded with Fura-2/AM and were microinjected with 100 nM NAADP, 100 nM NAADP plus 1 mM nicotinamide, or 100 nM NAADP plus 1 mM nicotinic acid, or intracellular buffer. Free cytosolic Ca2+ ([Ca2+]i) was measured. Mean data of 4–12 experiments are shown (Upper). The bar chart (Lower) summarizes the data (Ca2+ peak and Ca2+ plateau; means ± SEM., n = 4 – 12; ∗, P ≤ 0.05; ns, not significant). (C) Inhibition of NAADP-induced Ca2+ signaling upon co-injection with BZ194. Jurkat T cells were co-injected with 100 nM NAADP and increasing concentrations of BZ194. Mean data of 5–13 experiments are shown. (D) Concentration-response curve of NAADP-induced Ca2+ signaling upon microinjection with BZ194 (mean ± SEM, n = 5–13; ∗, P ≤ 0.05). (E) BZ194 does not directly interfere with InsP3- or cADPR-mediated Ca2+ release. Jurkat T cells were loaded with Fura2/AM. Thereafter, single cells were co-injected with 1 mM BZ194 and either NAADP (100 nM), InsP3 (4 μM), or cADPR (100 μM), and Ca2+ signaling was recorded. Relative values are shown as percentages of NAADP-induced [Ca2+]i. Data represent means ± SEM, n = 5–13; ∗, P ≤ 0.05; ns, not significant.
Fig. 2.
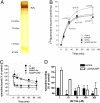
Targeting of NAADP RyR1 interaction by BZ194. (A) Silver-stained gel demonstrating the purity of RyR1 preparation. (B) Kinetics of NAADP-induced association of [3H] ryanodine to the purified RyR1 at 30 °C. Specific [3H]ryanodine binding in the absence (control) or presence of 300 nM NAADP; BZ194 (100 μM) was combined with both control and NAADP experiments. Asterisk (*) denotes statistical significance of NAADP over control, cross (#) that of BZ194 plus NAADP over NAADP alone. Data are mean ± SD. (n = 4). (C) After 2 h of association, dissociation of bound [3H] ryanodine (20 nM) was triggered by 20 μM cold ryanodine (ry) in the absence or presence of 300 nM NAADP or 100 μM BZ194 (BZ) at 30 °C. Data are mean ± SD. (n = 4). (D) Inhibition of NAADP-stimulated [3H]ryanodine binding to RyR1 by increasing concentrations of BZ194 after 2 h at 30 °C. Data are mean ± SEM (n = 2–14).
Fig. 3.
RyR expression and antagonism of Ca2+ signaling in rat MBP-specific effector T cells. (A) Expression of RyR subtypes in effector T cells. Immunofluorescence for RyR1 to 3 (red) and the endoplasmatic reticulum marker protein disulphide isomerase (PDI, green). (Scale bar, 10 μm.) (B) Suppression of Ca2+ signaling in Fura2-loaded TMBP cells stimulated in the presence of MBP-pulsed astrocytes. Rat F10 astrocytes with up-regulated MHC II expression were pulsed with MBP. TMBP cells, either preincubated with BZ194 (2 mM, MBP + BZ194) or left untreated (MBP), were loaded with Fura-2/AM and added to the astrocytes. In control experiments, astrocytes were not pulsed with MBP (control). Time point 0 was defined as first visible contact between a T cell and an astrocyte. Ca2+ imaging was performed as detailed in
SI Methods
. (B) shows a representative experiment with T cells highlighted by white lines in the brightfield images. (Scale bar, 5 μm.) (C) Mean global [Ca2+]i data from 14 (control: no MBP), 30 (MBP pulsed astrocytes), or 31 (MBP pulsed astrocytes plus T cells preincubated with BZ194) T cells are displayed. (D) Resting rat TMBP cells were loaded with Fura2/AM and cell suspension measurements were carried out as described in Methods. Arrows indicate the addition of αCD3 or crosslinking (X) antibodies. Cells were preincubated with 500 μM BZ194 overnight. (E) Concentration-response curves summarizing data from (D) (transient Ca2+ peak and Ca2+ plateau; mean± SEM, n = 8–9). (F) Effect of BZ194 preincubation time on Ca2+ signaling (mean ± SEM, n = 8–9). (G) Cells were preincubated with 1 mM BZ194 overnight and thapsigargin (1 mM, arrow) was added to induce capacitative Ca2+ signaling; mean data ± SEM (n = 9) are summarized in H. ∗, P ≤ 0.05 according to Student's t test; ns, not significant.
Fig. 4.
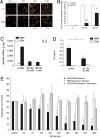
NAADP signaling is essential for efficient activation of antigen-specific effector T cells. (A) BZ194 reduces NFAT-1 nuclear translocation. Immunocytochemistry of BZ194-treated or control (DMSO- treated) TMBP cells 0, 30, or 60 min after stimulation with αCD3/CD28 antibodies. Red, DAPI staining; green, NFAT-1 or isotype control staining. (Scale bars, 10 μm.) Representative data of 3 independent experiments are shown. (B) Quantification of NFAT-1 nuclear translocation, expressed as percent of cells. Values respresent means ± SD, data from 3 independent experiments including at least 150 cells per counting. P values: ∗, P ≤ 0.05; ∗∗, P ≤ 0.01. (C–E) BZ194 suppresses activation-induced IL-2 expression in rat and human TMBP cells. (C) Quantitative PCR of rat TMBP cells challenged with control antigen- (OVA, white) or MBP- (black) pulsed APCs in the presence of vehicle (control), 0.5 or 1 mM BZ194. mRNA was extracted 48 h after stimulation. Values are normalized to β actin mRNA. Representative data of 3 independent experiments are shown. All differences are statistically significant (P value, P at least ≤ 0.05). (D) IL-2 protein release of TMBP cells 48 h after stimulation, determined by ELISA. Values represent means ± SD of triplicate measurements. Representative data of at least 2 independent experiments are shown. ∗, P ≤ 0.0001. (E) BZ194 blocks antigen-induced T cell proliferation, but does not interfere with T-cell activation cascades beyond Ca2+ signaling. TMBP cells incubated with the indicated amounts of BZ194 were stimulated with αCD3/CD28 antibodies (black bars), PMA/ionomycin (white bars) or αCD3/CD28 antibodies + ionomycin (gray bars). TMBP cells reactivity was determined by [3H]dT incorporation 2 d later. Proliferation is indicated as percent of control (no BZ194 treatment; CD3/CD28 stimulation: 6445 ± 475 cpm; CD3/CD28 + ionomycin stimulation: 6624 ± 320 cpm; PMA/ionomycin stimulation: 5264 ± 521cpm). Data represent means ± SD of measurements from 5 independent experiments. ∗, P ≤ 0.01.
Similar articles
- Ca2+ release via ryanodine receptors and Ca2+ entry: major mechanisms in NAADP-mediated Ca2+ signaling in T-lymphocytes.
Langhorst MF, Schwarzmann N, Guse AH. Langhorst MF, et al. Cell Signal. 2004 Nov;16(11):1283-9. doi: 10.1016/j.cellsig.2004.03.013. Cell Signal. 2004. PMID: 15337527 - Frontrunners of T cell activation: Initial, localized Ca2+ signals mediated by NAADP and the type 1 ryanodine receptor.
Wolf IM, Diercks BP, Gattkowski E, Czarniak F, Kempski J, Werner R, Schetelig D, Mittrücker HW, Schumacher V, von Osten M, Lodygin D, Flügel A, Fliegert R, Guse AH. Wolf IM, et al. Sci Signal. 2015 Oct 13;8(398):ra102. doi: 10.1126/scisignal.aab0863. Sci Signal. 2015. PMID: 26462735 - Functional ryanodine receptor expression is required for NAADP-mediated local Ca2+ signaling in T-lymphocytes.
Dammermann W, Guse AH. Dammermann W, et al. J Biol Chem. 2005 Jun 3;280(22):21394-9. doi: 10.1074/jbc.M413085200. Epub 2005 Mar 17. J Biol Chem. 2005. PMID: 15774471 - Ca(2+) microdomains, NAADP and type 1 ryanodine receptor in cell activation.
Guse AH, Wolf IM. Guse AH, et al. Biochim Biophys Acta. 2016 Jun;1863(6 Pt B):1379-84. doi: 10.1016/j.bbamcr.2016.01.014. Epub 2016 Jan 22. Biochim Biophys Acta. 2016. PMID: 26804481 Review. - Cyclic ADP-ribose and NAADP: fraternal twin messengers for calcium signaling.
Lee HC. Lee HC. Sci China Life Sci. 2011 Aug;54(8):699-711. doi: 10.1007/s11427-011-4197-3. Epub 2011 Jul 24. Sci China Life Sci. 2011. PMID: 21786193 Review.
Cited by
- 25 Years of Collaboration with A Genius: Deciphering Adenine Nucleotide Ca2+ Mobilizing Second Messengers Together with Professor Barry Potter.
Guse AH. Guse AH. Molecules. 2020 Sep 15;25(18):4220. doi: 10.3390/molecules25184220. Molecules. 2020. PMID: 32942537 Free PMC article. Review. - Bidirectional coupling between ryanodine receptors and Ca2+ release-activated Ca2+ (CRAC) channel machinery sustains store-operated Ca2+ entry in human T lymphocytes.
Thakur P, Dadsetan S, Fomina AF. Thakur P, et al. J Biol Chem. 2012 Oct 26;287(44):37233-44. doi: 10.1074/jbc.M112.398974. Epub 2012 Sep 4. J Biol Chem. 2012. PMID: 22948152 Free PMC article. - NAADP Receptors.
Galione A. Galione A. Cold Spring Harb Perspect Biol. 2019 Nov 1;11(11):a035071. doi: 10.1101/cshperspect.a035071. Cold Spring Harb Perspect Biol. 2019. PMID: 31182546 Free PMC article. Review. - T lymphocytes from malignant hyperthermia-susceptible mice display aberrations in intracellular calcium signaling and mitochondrial function.
Yang L, Dedkova EN, Allen PD, Jafri MS, Fomina AF. Yang L, et al. Cell Calcium. 2021 Jan;93:102325. doi: 10.1016/j.ceca.2020.102325. Epub 2020 Dec 1. Cell Calcium. 2021. PMID: 33310301 Free PMC article. - Preferential Coupling of the NAADP Pathway to Exocytosis in T-Cells.
Davis LC, Platt FM, Galione A. Davis LC, et al. Messenger (Los Angel). 2015 Jun;4(1):53-66. doi: 10.1166/msr.2015.1040. Messenger (Los Angel). 2015. PMID: 27330870 Free PMC article.
References
- Feske S, et al. A mutation in Orai1 causes immune deficiency by abrogating CRAC channel function. Nature. 2006;441:179–185. - PubMed
- Streb H, Irvine RF, Berridge MJ, Schulz I. Release of Ca2+ from a nonmitochondrial intracellular store in pancreatic acinar cells by inositol-1,4,5-trisphosphate. Nature. 1983;306:67–69. - PubMed
Publication types
MeSH terms
Substances
LinkOut - more resources
Full Text Sources
Other Literature Sources
Research Materials
Miscellaneous


