Genome-wide comparisons of variation in linkage disequilibrium - PubMed (original) (raw)
Comparative Study
. 2009 Oct;19(10):1849-60.
doi: 10.1101/gr.092189.109. Epub 2009 Jun 18.
Affiliations
- PMID: 19541915
- PMCID: PMC2765270
- DOI: 10.1101/gr.092189.109
Comparative Study
Genome-wide comparisons of variation in linkage disequilibrium
Yik Y Teo et al. Genome Res. 2009 Oct.
Abstract
Current genome-wide surveys of common diseases and complex traits fundamentally aim to detect indirect associations where the single nucleotide polymorphisms (SNPs) carrying the association signals are not biologically active but are in linkage disequilibrium (LD) with some unknown functional polymorphisms. Reproducing any novel discoveries from these genome-wide scans in independent studies is now a prerequisite for the putative findings to be accepted. Significant differences in patterns of LD between populations can affect the portability of phenotypic associations when the replication effort or meta-analyses are attempted in populations that are distinct from the original population in which the genome-wide study is performed. Here, we introduce a novel method for genome-wide analyses of LD variations between populations that allow the identification of candidate regions with different patterns of LD. The evidence of LD variation provided by the introduced method correlated with the degree of differences in the frequencies of the most common haplotype across the populations. Identified regions also resulted in greater variation in the success of replication attempts compared with random regions in the genome. A separate permutation strategy introduced for assessing LD variation in the absence of genome-wide data also correctly identified the expected variation in LD patterns in two well-established regions undergoing strong population-specific evolutionary pressure. Importantly, this method addresses whether a failure to reproduce a disease association in a disparate population is due to underlying differences in LD structure with an unknown functional polymorphism, which is vital in the current climate of replicating and fine-mapping established findings from genome-wide association studies.
Figures
Figure 1.
Comparisons across different window sizes L. Comparisons of the standardized scores for regions identified in our analysis of LD differences between HapMap CEU vs. WTCCC 58C with different numbers of SNPs in each window. Four separate analyses were run with L = 25, 50, 100, and 200 SNPs, respectively, where comparisons were made against the regions identified with L = 50. For each of the regions identified for L = 50, we noted the maximum standardized varLD scores in this region in the analyses with L = 25 (A), 100 (B), and 200 (C). Each point in the figures represents a region identified in the original analysis with L = 50. The size and shade of each point indicates the relative size of the region, with larger circles and darker shades of gray indicating larger regions. (Black shading) Regions with sizes >500 kb.
Figure 2.
LD variation at the NRG1 gene on chromosome 8. (Upper panel) Standardized varLD scores across the region encapsulating the NRG1 gene. (Red points) LD comparisons between HapMap Europeans (CEU) and HapMap Asians (CHB and JPT); (purple points) LD comparisons between HapMap Europeans (CEU) and HapMap Africans (YRI); (cyan points) LD comparisons between HapMap Africans (YRI) and HapMap Asians (CHB and JPT). (Dotted lines) Values of the corresponding thresholds. (Middle panel) Fine-scale recombination rates in the region from the combined HapMap samples. Positions of genes in the region shown in the bottom panel were obtained from Ensembl. All coordinates shown are in NCBI Build 35 (dbSNP build 125).
Figure 3.
Differences in statistical evidence at the associated SNP in CEU and CHB+JPT. Comparison of the −log10 _P_-value from a test of association between 2000 simulated cases and 2000 simulated controls at an associated SNP in each of the HapMap CEU and CHB+JPT populations. For each SNP, the larger −log10 _P_-value is set as the baseline and is mapped to zero, and we only plot the difference of the −log10 _P_-values. The regions are then ranked from left to right by increasing the degree of the difference in statistical evidence between CEU and CHB+JPT. (A) Three hundred randomly selected regions that have been identified by varLD to be in the top fifth percentile of the genome-wide distribution. (B) Three hundred regions that have been randomly selected across the genome, where each region spans an identical physical distance to one of the 300 varLD-identified regions from A. (Green circles) Differential statistical evidence observed in the CEU; (red circles) differential statistical evidence observed in the CHB+JPT.
Figure 4.
Heatmap representations of LD in two genomic regions between pairs of populations in HapMap. The upper left and lower right triangles of each plot correspond to the LD in a region for each of two populations, respectively, as measured by the pairwise _r_2 metric, with the plots in the first column comparing HapMap Europeans with HapMap Asians, the second column comparing HapMap Europeans with HapMap Africans, and the last column comparing HapMap Africans with HapMap Asians. The plots in the first row depict the same genomic region on chromosome 2 of 136.26 Mb–136.38 Mb spanning the LCT gene, while the plots in the second row depict the genomic region on chromosome 1 of 155.9 Mb–156.0 Mb spanning the DARC gene.
Figure 5.
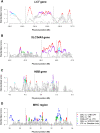
Standardized varLD scores across different population pairs in established regions undergoing positive natural selection or containing high haplotype diversity. The standardized varLD signals for each population pair are shown, and only scores above their respective 95th quantiles are illustrated in a nongray color. (Red points) LD comparisons between HapMap Europeans (CEU) and HapMap Asians (CHB and JPT); (purple points) LD comparisons between HapMap Europeans (CEU) and HapMap Africans (YRI); (cyan points) LD comparisons between HapMap Africans (YRI) and HapMap Asians (CHB and JPT); (green points) LD comparisons between two European populations (HapMap CEU vs. WTCCC 58C); (blue points) LD comparisons between two African populations (HapMap YRI vs. the Gambian Jola). The four regions considered contain the LCT gene in chromosome 2 undergoing selection in European populations (A), the SLC24A5 gene in chromosome 15 reported for association with skin pigmentation in Europeans (B), the HBB gene in chromosome 11 with well-documented haplotypic differences between the two populations considered (C), and the highly polymorphic MHC region in chromosome 6 (D). (Dotted lines) Approximate start and end positions of the gene/region in each panel.
Figure 6.
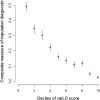
Imputation diagnostics and standardized varLD scores. Comparison of the standardized varLD score against imputation diagnostics generated by IMPUTE when the HapMap YRI is used as a reference panel against Gambian Jola data. The imputation algorithm calculates a measure of information and a confidence score based on the average maximum posterior probability, which we used as surrogates of imputation accuracy. A composite measure of imputation accuracy as measured by the product of call rate and genotype concordance is calculated for the 10 deciles of varLD scores found in the top 20th percentile of the genome-wide distribution of varLD scores. As concordance is measured as the proportion of agreement between the imputed and observed genotypes for the Gambian Jola samples, we only consider autosomal SNPs on the Affymetrix array that are found in the regions identified by varLD.
Figure 7.
Genotype assignment and hybridization intensity profiles of a SNP in a region containing deletions. The two axes represent the fluorescence intensities that indicate the extent of hybridization to the two possible alleles of a biallelic SNP, which have been generically defined as alleles A and B. Solid circles in red, green, blue, and gray indicate samples whose genotypes have been assigned as AA, AB, BB, and NULL (missing), respectively. (Dashed ellipses) Intensity profiles that correspond to homozygous deletion (gray), hemizygous A deletion (light green), hemizygous B deletion (purple), genotype AA (red), genotype AB (dark green), and genotype BB (blue). The figure illustrates that samples with hemizygous deletions have been erroneously assigned to homozygous genotypes, while samples with homozygous deletions have been classified as missing.
Similar articles
- Similarity in recombination rate and linkage disequilibrium at CYP2C and CYP2D cytochrome P450 gene regions among Europeans indicates signs of selection and no advantage of using tagSNPs in population isolates.
Pimenoff VN, Laval G, Comas D, Palo JU, Gut I, Cann H, Excoffier L, Sajantila A. Pimenoff VN, et al. Pharmacogenet Genomics. 2012 Dec;22(12):846-57. doi: 10.1097/FPC.0b013e32835a3a6d. Pharmacogenet Genomics. 2012. PMID: 23089684 - varLD: a program for quantifying variation in linkage disequilibrium patterns between populations.
Ong RT, Teo YY. Ong RT, et al. Bioinformatics. 2010 May 1;26(9):1269-70. doi: 10.1093/bioinformatics/btq125. Epub 2010 Mar 22. Bioinformatics. 2010. PMID: 20308177 - Performance of random forest when SNPs are in linkage disequilibrium.
Meng YA, Yu Y, Cupples LA, Farrer LA, Lunetta KL. Meng YA, et al. BMC Bioinformatics. 2009 Mar 5;10:78. doi: 10.1186/1471-2105-10-78. BMC Bioinformatics. 2009. PMID: 19265542 Free PMC article. - Accounting for linkage disequilibrium in association analysis of diverse populations.
Charles BA, Shriner D, Rotimi CN. Charles BA, et al. Genet Epidemiol. 2014 Apr;38(3):265-73. doi: 10.1002/gepi.21788. Epub 2014 Jan 26. Genet Epidemiol. 2014. PMID: 24464495 Review.
Cited by
- Conditional and joint multiple-SNP analysis of GWAS summary statistics identifies additional variants influencing complex traits.
Yang J, Ferreira T, Morris AP, Medland SE; Genetic Investigation of ANthropometric Traits (GIANT) Consortium; DIAbetes Genetics Replication And Meta-analysis (DIAGRAM) Consortium; Madden PA, Heath AC, Martin NG, Montgomery GW, Weedon MN, Loos RJ, Frayling TM, McCarthy MI, Hirschhorn JN, Goddard ME, Visscher PM. Yang J, et al. Nat Genet. 2012 Mar 18;44(4):369-75, S1-3. doi: 10.1038/ng.2213. Nat Genet. 2012. PMID: 22426310 Free PMC article. - Efficiency of trans-ethnic genome-wide meta-analysis and fine-mapping.
Ong RT, Wang X, Liu X, Teo YY. Ong RT, et al. Eur J Hum Genet. 2012 Dec;20(12):1300-7. doi: 10.1038/ejhg.2012.88. Epub 2012 May 23. Eur J Hum Genet. 2012. PMID: 22617345 Free PMC article. - Searching for the human genetic factors standing in the way of universally effective vaccines.
Mentzer AJ, O'Connor D, Pollard AJ, Hill AV. Mentzer AJ, et al. Philos Trans R Soc Lond B Biol Sci. 2015 Jun 19;370(1671):20140341. doi: 10.1098/rstb.2014.0341. Philos Trans R Soc Lond B Biol Sci. 2015. PMID: 25964463 Free PMC article. Review. - Testing Domestication Scenarios of Lima Bean (Phaseolus lunatus L.) in Mesoamerica: Insights from Genome-Wide Genetic Markers.
Chacón-Sánchez MI, Martínez-Castillo J. Chacón-Sánchez MI, et al. Front Plant Sci. 2017 Sep 12;8:1551. doi: 10.3389/fpls.2017.01551. eCollection 2017. Front Plant Sci. 2017. PMID: 28955351 Free PMC article. - Detection of selection signatures in Piemontese and Marchigiana cattle, two breeds with similar production aptitudes but different selection histories.
Sorbolini S, Marras G, Gaspa G, Dimauro C, Cellesi M, Valentini A, Macciotta NP. Sorbolini S, et al. Genet Sel Evol. 2015 Jun 23;47(1):52. doi: 10.1186/s12711-015-0128-2. Genet Sel Evol. 2015. PMID: 26100250 Free PMC article.
References
- Bentires-Alj M, Paez JG, David FS, Keilhack H, Halmos B, Naoki K, Maris JM, Richardson A, Bardelli A, Sugarbaker DJ, et al. Activating mutations of the Noonan syndrome-associated SHP2/PTPN11 gene in human solid tumors and adult acute myelogenous leukemia. Cancer Res. 2004;64:8816–8820. - PubMed
- Chanock SJ, Manolio T, Boehnke M, Boerwinkle E, Hunter DJ, Thomas G, Hirschhorn JN, Abecasis G, Altshuler D, Bailey-Wilson JE, et al. Replicating genotype–phenotype associations. Nature. 2007;447:655–660. - PubMed
- Clark AG, Li J. Conjuring SNPs to detect associations. Nat Genet. 2007;39:815–816. - PubMed
- Conrad DF, Andrews TD, Carter NP, Hurles ME, Pritchard JK. A high-resolution survey of deletion polymorphism in the human genome. Nat Genet. 2006;38:75–81. - PubMed
Publication types
MeSH terms
LinkOut - more resources
Full Text Sources
Research Materials


