Sensitive detection of chromosomal segments of distinct ancestry in admixed populations - PubMed (original) (raw)
Sensitive detection of chromosomal segments of distinct ancestry in admixed populations
Alkes L Price et al. PLoS Genet. 2009 Jun.
Abstract
Identifying the ancestry of chromosomal segments of distinct ancestry has a wide range of applications from disease mapping to learning about history. Most methods require the use of unlinked markers; but, using all markers from genome-wide scanning arrays, it should in principle be possible to infer the ancestry of even very small segments with exquisite accuracy. We describe a method, HAPMIX, which employs an explicit population genetic model to perform such local ancestry inference based on fine-scale variation data. We show that HAPMIX outperforms other methods, and we explore its utility for inferring ancestry, learning about ancestral populations, and inferring dates of admixture. We validate the method empirically by applying it to populations that have experienced recent and ancient admixture: 935 African Americans from the United States and 29 Mozabites from North Africa. HAPMIX will be of particular utility for mapping disease genes in recently admixed populations, as its accurate estimates of local ancestry permit admixture and case-control association signals to be combined, enabling more powerful tests of association than with either signal alone.
Conflict of interest statement
The authors have declared that no competing interests exist.
Figures
Figure 1. Schematic of the Markov model we use for ancestry inference.
The black lower line represents a chromosomal segment from an admixed individual, carrying a number of typed mutations (black circles). The underlying ancestry is shown in the bottom color bar, and reveals an ancestry change from the first population (red) to the second population (blue). The admixed chromosome is modeled as a mosaic of segments of DNA from two sets of individuals drawn from different reference populations (red and blue horizontal lines respectively) closely related to the progenitor populations for the admixture event. The yellow line shows how the admixed chromosome is constructed in terms of this mosaic. The dotted line above the bottom color bar shows the reference population being copied from along the chromosome – note that at most positions, this is identical to the true underlying ancestry, but with occasional “miscopying” from the other population (blue dotted segment occurring within red ancestry segment). Note also that switches between chromosomes being copied from, representing historical recombinations, are rapid (6 switches), while ancestry changes, representing recombination since admixture, are much rarer (1 switch). Finally, note that at most positions the type of the admixed chromosome is identical to that of the chromosome being copied from, but an exception to this occurs at one site, shown as a grey circle, and representing mutation or genotyping error. In our inference framework, we observe only the variation data for the admixed and reference individuals: the yellow line, and the underlying ancestry, must be inferred as the hidden states in a HMM.
Figure 2. Comparison of ancestry estimates produced by HAPMIX, ANCESTRYMAP, and LAMP-ANC.
(A) Results comparison for a simulated recently admixed sample on chromosome 1. On each plot, the y-axis denotes the number of European chromosomal copies predicted by each method. The centromere of the chromosome is blanked out in white. The top plot shows the true number of European chromosomes, while the subsequent labeled plots show the results of applying each respective method. (B) Results comparison for a real African American individual across chromosome 1. Plots are constructed as in (A). We note the visible similarity to the simulation results.
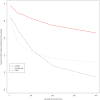
Figure 3. Accuracy of HAPMIX, ANCESTRYMAP, and LAMP-ANC predictions for various values of λ, the number of generations since admixture.
For each admixture time, results are based on analyzing 20 admixed individuals, simulated using an average genome-wide proportion of 80% African and 20% European ancestry. For each method, we plot the squared correlation between predicted and true number of European copies as a function of λ.
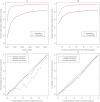
Figure 4. Properties of HAPMIX.
(A) For simulated admixed data sets, constructed as described in Materials and Methods using λ = 6 and λ = 100, we plot the r 2 between predicted and true number of European chromosomal copies, as a function of the number of markers genotyped across the genome. (B) The same as part A, except we now fix the number of markers genotyped at 500,000, and vary the number of input chromosomes used to predict ancestry (for full details, see text). (C) Calibration of uncertainty estimates produced by HAPMIX. For the λ = 6 simulations, and for each of x = 0, x = 1, and x = 2 we compare the average probability of x copies of European ancestry predicted by HAPMIX to the true frequency of having x copies of European ancestry, binning the predicted probabilities of x copies of European ancestry into bins of size 0.05. If the method were perfectly calibrated, the results would lie along the line y = x (thin black line). Note that for λ = 6, ancestry is normally inferred with high certainty, and over 98% of data points fall into the most extreme two bins. (D) The same as part A, except using λ = 100. Both the last two plots show reasonable calibration of HAPMIX.
Figure 5. Correlation between ancestry proportion and estimated time since admixture in African Americans.
Each grey point shows an estimate of the time λ since admixture corresponding to one of 935 analysed African American individuals (Materials and Methods). The red line shows sliding averages of 20 individuals, binned according to increasing African ancestry proportions.
Figure 6. Local ancestry estimates produced by HAPMIX for a simulated anciently admixed sample on chromosome 1, simulated using 80% European and 20% African ancestry, with the admixture occurring 100 generations ago.
As in Figure 2, the top plot shows the truth, while the second plot shows the HAPMIX inference. We plot the true number of African chromosomes on chromosome 1 (top plot), together with the number of African copies predicted by HAPMIX (bottom plot).
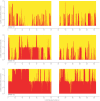
Figure 7. Local ancestry estimates produced by HAPMIX for three real Mozabite individuals on chromosome 1.
The plots are constructed as for Figure 5, and show HAPMIX estimates of the number of sub-Saharan African copies across chromosome 1 for three individuals chosen for having different genome-wide African ancestries: 20% (top plot), 29% (middle plot) and 75% (bottom plot). The top plot looks similar to Figure 5, while the much longer segments seen in the two individuals with more African ancestry indicate more recent admixture with sub-Saharan Africans.
Figure 8. Principal components analysis of Mozabite, French, and Yoruba samples from the HGDP.
Similar articles
- Exploring population admixture dynamics via empirical and simulated genome-wide distribution of ancestral chromosomal segments.
Jin W, Wang S, Wang H, Jin L, Xu S. Jin W, et al. Am J Hum Genet. 2012 Nov 2;91(5):849-62. doi: 10.1016/j.ajhg.2012.09.008. Epub 2012 Oct 25. Am J Hum Genet. 2012. PMID: 23103229 Free PMC article. - Enhanced statistical tests for GWAS in admixed populations: assessment using African Americans from CARe and a Breast Cancer Consortium.
Pasaniuc B, Zaitlen N, Lettre G, Chen GK, Tandon A, Kao WH, Ruczinski I, Fornage M, Siscovick DS, Zhu X, Larkin E, Lange LA, Cupples LA, Yang Q, Akylbekova EL, Musani SK, Divers J, Mychaleckyj J, Li M, Papanicolaou GJ, Millikan RC, Ambrosone CB, John EM, Bernstein L, Zheng W, Hu JJ, Ziegler RG, Nyante SJ, Bandera EV, Ingles SA, Press MF, Chanock SJ, Deming SL, Rodriguez-Gil JL, Palmer CD, Buxbaum S, Ekunwe L, Hirschhorn JN, Henderson BE, Myers S, Haiman CA, Reich D, Patterson N, Wilson JG, Price AL. Pasaniuc B, et al. PLoS Genet. 2011 Apr;7(4):e1001371. doi: 10.1371/journal.pgen.1001371. Epub 2011 Apr 21. PLoS Genet. 2011. PMID: 21541012 Free PMC article. - Detecting Heterogeneity in Population Structure Across the Genome in Admixed Populations.
McHugh C, Brown L, Thornton TA. McHugh C, et al. Genetics. 2016 Sep;204(1):43-56. doi: 10.1534/genetics.115.184184. Epub 2016 Jul 20. Genetics. 2016. PMID: 27440868 Free PMC article. - Mapping of disease-associated variants in admixed populations.
Shriner D, Adeyemo A, Ramos E, Chen G, Rotimi CN. Shriner D, et al. Genome Biol. 2011;12(5):223. doi: 10.1186/gb-2011-12-5-223. Epub 2011 May 30. Genome Biol. 2011. PMID: 21635713 Free PMC article. Review. - Prospective avenues for human population genomics and disease mapping in southern Africa.
Swart Y, van Eeden G, Sparks A, Uren C, Möller M. Swart Y, et al. Mol Genet Genomics. 2020 Sep;295(5):1079-1089. doi: 10.1007/s00438-020-01684-8. Epub 2020 May 21. Mol Genet Genomics. 2020. PMID: 32440765 Free PMC article. Review.
Cited by
- A spatial haplotype copying model with applications to genotype imputation.
Yang WY, Hormozdiari F, Eskin E, Pasaniuc B. Yang WY, et al. J Comput Biol. 2015 May;22(5):451-62. doi: 10.1089/cmb.2014.0151. Epub 2014 Dec 19. J Comput Biol. 2015. PMID: 25526526 Free PMC article. - Ancestry inference in complex admixtures via variable-length Markov chain linkage models.
Rodriguez JM, Bercovici S, Elmore M, Batzoglou S. Rodriguez JM, et al. J Comput Biol. 2013 Mar;20(3):199-211. doi: 10.1089/cmb.2012.0088. Epub 2013 Feb 19. J Comput Biol. 2013. PMID: 23421795 Free PMC article. - Na Li and Matthew Stephens on Modeling Linkage Disequilibrium.
Song YS. Song YS. Genetics. 2016 Jul;203(3):1005-6. doi: 10.1534/genetics.116.191817. Genetics. 2016. PMID: 27384022 Free PMC article. No abstract available. - Population genetic inference from personal genome data: impact of ancestry and admixture on human genomic variation.
Kidd JM, Gravel S, Byrnes J, Moreno-Estrada A, Musharoff S, Bryc K, Degenhardt JD, Brisbin A, Sheth V, Chen R, McLaughlin SF, Peckham HE, Omberg L, Bormann Chung CA, Stanley S, Pearlstein K, Levandowsky E, Acevedo-Acevedo S, Auton A, Keinan A, Acuña-Alonzo V, Barquera-Lozano R, Canizales-Quinteros S, Eng C, Burchard EG, Russell A, Reynolds A, Clark AG, Reese MG, Lincoln SE, Butte AJ, De La Vega FM, Bustamante CD. Kidd JM, et al. Am J Hum Genet. 2012 Oct 5;91(4):660-71. doi: 10.1016/j.ajhg.2012.08.025. Am J Hum Genet. 2012. PMID: 23040495 Free PMC article. - Call of the wild rice: Oryza rufipogon shapes weedy rice evolution in Southeast Asia.
Vigueira CC, Qi X, Song BK, Li LF, Caicedo AL, Jia Y, Olsen KM. Vigueira CC, et al. Evol Appl. 2018 Jan 11;12(1):93-104. doi: 10.1111/eva.12581. eCollection 2019 Jan. Evol Appl. 2018. PMID: 30622638 Free PMC article.
References
Publication types
MeSH terms
Grants and funding
- U01 HG004168/HG/NHGRI NIH HHS/United States
- R01 HL087699/HL/NHLBI NIH HHS/United States
- ImNIH/Intramural NIH HHS/United States
- U01-HG004168/HG/NHGRI NIH HHS/United States
- R01-HL087699/HL/NHLBI NIH HHS/United States
LinkOut - more resources
Full Text Sources
Other Literature Sources


