MicroCT for comparative morphology: simple staining methods allow high-contrast 3D imaging of diverse non-mineralized animal tissues - PubMed (original) (raw)
MicroCT for comparative morphology: simple staining methods allow high-contrast 3D imaging of diverse non-mineralized animal tissues
Brian D Metscher. BMC Physiol. 2009.
Abstract
Background: Comparative, functional, and developmental studies of animal morphology require accurate visualization of three-dimensional structures, but few widely applicable methods exist for non-destructive whole-volume imaging of animal tissues. Quantitative studies in particular require accurately aligned and calibrated volume images of animal structures. X-ray microtomography (microCT) has the potential to produce quantitative 3D images of small biological samples, but its widespread use for non-mineralized tissues has been limited by the low x-ray contrast of soft tissues. Although osmium staining and a few other techniques have been used for contrast enhancement, generally useful methods for microCT imaging for comparative morphology are still lacking.
Results: Several very simple and versatile staining methods are presented for microCT imaging of animal soft tissues, along with advice on tissue fixation and sample preparation. The stains, based on inorganic iodine and phosphotungstic acid, are easier to handle and much less toxic than osmium, and they produce high-contrast x-ray images of a wide variety of soft tissues. The breadth of possible applications is illustrated with a few microCT images of model and non-model animals, including volume and section images of vertebrates, embryos, insects, and other invertebrates. Each image dataset contains x-ray absorbance values for every point in the imaged volume, and objects as small as individual muscle fibers and single blood cells can be resolved in their original locations and orientations within the sample.
Conclusion: With very simple contrast staining, microCT imaging can produce quantitative, high-resolution, high-contrast volume images of animal soft tissues, without destroying the specimens and with possibilities of combining with other preparation and imaging methods. Such images are expected to be useful in comparative, developmental, functional, and quantitative studies of morphology.
Figures
Figure 1
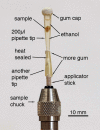
Mounting arrangement for scanning samples in liquid. A pipette tip is heat-sealed at its tip and filled with alcohol, and the sample is wedged gently into the tapering container. Adhesive putty such as UHU Patafix is used to prevent alcohol evaporation and also to hold the container tip in place in another cut-off tip mounted on a 2 mm-diameter wooden applicator stick, which is then mounted into the chuck supplied with the MicroXCT scanner.
Figure 2
Multiple views from a single scan of a 7-day post-hatching paddlefish (Polyodon spathula). Fixed in Bouin's, stored in 70% ethanol, stained with PTA. By adjusting the window and transparency functions, a volume rendering can be made to show a mix of internal and external structures. The lateral line receptors are especially prominent in these images, as are the nasal capsules and muscles. Voxel size 5.6 μm. Additional Files 1 and 2 are QuickTime movies of other PTA-stained paddlefish scans, one earlier (4 days post-hatching) and one later (27 mm total length).
Figure 3
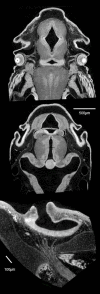
Virtual sections of Bouin's-fixed, PTA-stained fish specimens. Top two sections: Polyodon, 10 days post-hatching, horizontal sections through the head. Upper section shows the optic nerves, layers in the retina, and sections through the jaw adductor muscles. Middle section is more dorsal and shows neurocranial cartilage and otic chambers. Both sections show differential staining of brain tissues and the olfactory organs. Voxel size 4.3 μm. Bottom: European grayling (Thymallus thymallus) fixed in formalin and stained with PTA. This section shows the external naris (at top), the olfactory epithelium, and the olfactory nerve, as well as cranial cartilage. Voxel size 2.1 μm.
Figure 4
3D renderings of an axolotl (Ambystoma mexicanum) feeding larva. Glyoxal-fixed, stored in 70% ethanol, PTA-stained. Left column shows external views from the dorsal, left, and ventral sides, each with the background half deleted for clarity. Right column shows the same views, but with the foreground half removed. PTA staining highlights muscles and nervous tissues, as well as sensory organs: note the prominent nasal capsules and neuromasts. Horizontal bar = 500 μm. Voxel size 9.6 μm.
Figure 5
Pike (Esox lucius) fry fixed in formalin and stained with IKI. Volume renderings and virtual sections made from the concatenated stacks of reconstructed slices from two microCT scans made with the sample on the same rotation axis (i.e. translated only in the anterior-posterior direction), one scan of the fish’s head and the other of the pectoral region. This procedure allowed higher-resolution scanning of both body regions (at the expense of extra scanning time). Left: External views of an overall volume rendering, with the transparency adjusted to reveal some internal structures. Top right: Midsagittal cutaway of the same volume rendering. Center right: Single-voxel horizontal virtual section through the volume image. Bottom right: Coronal sections through the same volume image stack. One shows layers in the brain, sections through the jaw adductor muscles, and gill-arch cartilages; the other shows retinal layers, connections with the optic nerves, and the lenses, which tend to stain very heavily. Horizontal bar = 500 μm. Voxel size 4.0 μm. Additional File 3 is a QuickTime movie of the a volume reconstruction from these scans.
Figure 6
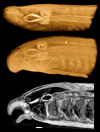
Juvenile lamprey (Lampetra), scanned with the SkyScan 1174. Fixed in formalin and stained with I2E after storage in alcohol. Whole specimen was approximately 10 cm in length. Top: ventral view of a horizontal cutaway volume rendering. Center: external view of the head region. Bottom: single reconstructed parasagittal section. Voxel size 15 μm. Sample provided by Daniel Sidertis, Univ. Vienna.
Figure 7
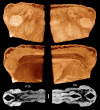
Iodine (I2M) staining of methanol-preserved samples. Left: Paddlefish Polyodon spathula, 11 days post-hatching, formalin-fixed and methanol dehydrated for in situ hybridization, stained with I2M. Voxel size 5.1 μm. Right: Green sturgeon (Acipenser medirostris, 65 mm total length; kindly provided by Boyd Kynard of the Conte Anadromous Fish Laboratory, MA) fixed in Dent's and stored in methanol, stained with I2M to demonstrate the pectoral musculature. Iodine tends to overstain calcified tissues: x-ray absorption by bone, scutes, and lepidotrichia is outside the image brightness window in these images. Scale bar = 1 mm. Voxel size 9.2 μm.
Figure 8
Xenopus embryos, stage ca. 27. Fixed in formalin and stained with PTA (left) and IKI (right). Bottom: virtual 1-voxel-thick horizontal sections; scale bar = 100 μm. Voxel size 2.1 μm (left) and 3.2 μm (right). Samples provided by Daniel Sidertis, Univ. Vienna.
Figure 9
Mouse embryos. Left: Virtual sections of a Theiler stage 21 mouse, paraformaldehyde-fixed and IKI-stained. Voxel size 9.0 μm. Center: Similar embryo, PTA-stained. Voxel size 9.6 μm. Right: Osmium-stained 12.5 dpc mouse embryo embedded and scanned in JB4 resin (standard TEM preparation). Voxel size 8.2 μm. Sample was prepared by R. Walsh (Life Sciences EM Facility, Penn State University), and the microCT scan was made in 2001 at the Mayo Clinic in the laboratory of Dr. Erik Ritman (Physiological Imaging Research Lab, Rochester MN). Additional Files 4 and 5 are QuickTime movies of this PTA-stained embryo and a stage 22 IKI-stained embryo.
Figure 10
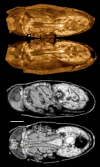
A neuropteran insect (genus Sisyra) showing musculature and general soft tissue morphology. Fixed in Bouin's fluid and stained with I2E, scanned in ethanol. Virtual horizontal sections one voxel thick (top), and cutaway volume renderings (bottom). Muscles are especially clearly defined, and the complete penetration of iodine makes it more suitable than PTA or osmium for whole insect specimens. Scale bars, 100 μm. Samples from Dominique Zimmermann, Natural History Museum, Vienna. Voxel size 4.3 μm (head + thorax, left), 2.0 μm (head, right).
Figure 11
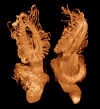
Tibia of a mantophasmid insect (undescribed genus), showing the vibration-sensitive scolopidial organ. Stereo pair for convergent (cross-eyed) viewing. Bouin's/alcohol fixed, PTA-stained. It was necessary to cut segments of leg no longer than 3–4 mm to allow the PTA to penetrate through. Diameter of the leg is approx. 300 μm. This volume rendering shows the scolopidial organ, and individual sensory cells and fibers, muscle fibers, and single blood cells can be resolved clearly. Insect chitin stains more heavily with PTA than with iodine. Sample from Monika Eberhard, Univ. Vienna. Voxel size 0.9 μm.
Figure 12
Late pupa of the flesh fly Calliphora vicinia (Diptera). Fixed in hot ethanol and stained with PTA. Pupae must be perforated for PTA to penetrate. Top: volume rendering with a horizontal cutaway. Bottom: parasagittal and horizontal single reconstructed sections. Scale bar: 1 mm. Samples prepared and provided by Marlis Forcher, Univ. Vienna. SkyScan 1174 scan, voxel size 7.7 μm.
Figure 13
A caudofoveate mollusc (Falcidens sp). Stained with osmium tetroxide and embedded in Spurr's resin for electron microscopy, scanned in resin block. Volume rendering (left) of a low-resolution scan, showing the anterior-most 1.4 mm of the animal. Cutaway volume rendering (center) and a single reconstructed section (right) of a higher resolution scan of the same block, showing the midgut region. This volume image was processed with a median filter (3 × 3 kernel). Scale bar = 100 μm. Voxel size 3.2 μm (left), 1.6 μm (center and right). Sample prepared and provided by Emanuel Redl, Univ. Vienna.
Figure 14
Volume rendering of the freshwater bryozoan Cristatella mucedo stained with PTA. Specimen was fixed in Bouin's and stained with PTA. Scanned in alcohol. Total length is approximately 2 mm. Voxel size 4.2 μm. Sample from Thomas Schwaha and Stephan Handschuh, Univ. Vienna.
Figure 15
Squid hatchlings, Ideosepius pygmeus, ca. 2 mm long. Fixed in gluteraldehyde, stored in cacodylate buffer, and stained with PTA (left) and IKI (right). The IKI staining required less than one hour. Voxel size 4.0 μm (left) and 4.4 μm (right). Samples from Janek von Byern, Univ. Vienna.
Similar articles
- MicroCT for developmental biology: a versatile tool for high-contrast 3D imaging at histological resolutions.
Metscher BD. Metscher BD. Dev Dyn. 2009 Mar;238(3):632-40. doi: 10.1002/dvdy.21857. Dev Dyn. 2009. PMID: 19235724 - Quantitative analysis of microscopic X-ray computed tomography imaging: Japanese quail embryonic soft tissues with iodine staining.
Tahara R, Larsson HC. Tahara R, et al. J Anat. 2013 Sep;223(3):297-310. doi: 10.1111/joa.12081. Epub 2013 Jul 22. J Anat. 2013. PMID: 23869493 Free PMC article. - Microscopic dual-energy CT (microDECT): a flexible tool for multichannel ex vivo 3D imaging of biological specimens.
Handschuh S, Beisser CJ, Ruthensteiner B, Metscher BD. Handschuh S, et al. J Microsc. 2017 Jul;267(1):3-26. doi: 10.1111/jmi.12543. Epub 2017 Mar 7. J Microsc. 2017. PMID: 28267884 - Diffusible iodine-based contrast-enhanced computed tomography (diceCT): an emerging tool for rapid, high-resolution, 3-D imaging of metazoan soft tissues.
Gignac PM, Kley NJ, Clarke JA, Colbert MW, Morhardt AC, Cerio D, Cost IN, Cox PG, Daza JD, Early CM, Echols MS, Henkelman RM, Herdina AN, Holliday CM, Li Z, Mahlow K, Merchant S, Müller J, Orsbon CP, Paluh DJ, Thies ML, Tsai HP, Witmer LM. Gignac PM, et al. J Anat. 2016 Jun;228(6):889-909. doi: 10.1111/joa.12449. Epub 2016 Mar 11. J Anat. 2016. PMID: 26970556 Free PMC article. Review. - Contrast-Enhanced MicroCT for Virtual 3D Anatomical Pathology of Biological Tissues: A Literature Review.
de Bournonville S, Vangrunderbeeck S, Kerckhofs G. de Bournonville S, et al. Contrast Media Mol Imaging. 2019 Feb 28;2019:8617406. doi: 10.1155/2019/8617406. eCollection 2019. Contrast Media Mol Imaging. 2019. PMID: 30944550 Free PMC article. Review.
Cited by
- The songbird syrinx morphome: a three-dimensional, high-resolution, interactive morphological map of the zebra finch vocal organ.
Düring DN, Ziegler A, Thompson CK, Ziegler A, Faber C, Müller J, Scharff C, Elemans CP. Düring DN, et al. BMC Biol. 2013 Jan 8;11:1. doi: 10.1186/1741-7007-11-1. BMC Biol. 2013. PMID: 23294804 Free PMC article. - 3D Muscle Architecture of the Pectoral Muscles of European Starling (Sturnus vulgaris).
Sullivan SP, McGechie FR, Middleton KM, Holliday CM. Sullivan SP, et al. Integr Org Biol. 2019 Feb 1;1(1):oby010. doi: 10.1093/iob/oby010. eCollection 2019. Integr Org Biol. 2019. PMID: 33791517 Free PMC article. - 3D Anatomy of the Quail Lumbosacral Spinal Canal-Implications for Putative Mechanosensory Function.
Kamska V, Daley M, Badri-Spröwitz A. Kamska V, et al. Integr Org Biol. 2020 Oct 30;2(1):obaa037. doi: 10.1093/iob/obaa037. eCollection 2020. Integr Org Biol. 2020. PMID: 33791575 Free PMC article. - Micro-CT-Based Quantification of Extracted Thrombus Burden Characteristics and Association With Angiographic Outcomes in Patients With ST-Elevation Myocardial Infarction: The QUEST-STEMI Study.
Karagiannidis E, Papazoglou AS, Sofidis G, Chatzinikolaou E, Keklikoglou K, Panteris E, Kartas A, Stalikas N, Zegkos T, Girtovitis F, Moysidis DV, Stefanopoulos L, Koupidis K, Hadjimiltiades S, Giannakoulas G, Arvanitidis C, Michaelson JS, Karvounis H, Sianos G. Karagiannidis E, et al. Front Cardiovasc Med. 2021 Apr 21;8:646064. doi: 10.3389/fcvm.2021.646064. eCollection 2021. Front Cardiovasc Med. 2021. PMID: 33969012 Free PMC article. - Three-dimensional histological specimen preparation for accurate imaging and spatial reconstruction of the middle and inner ear.
Rau TS, Würfel W, Lenarz T, Majdani O. Rau TS, et al. Int J Comput Assist Radiol Surg. 2013 Jul;8(4):481-509. doi: 10.1007/s11548-013-0825-7. Epub 2013 Apr 30. Int J Comput Assist Radiol Surg. 2013. PMID: 23633112 Free PMC article.
References
- Weninger WJ, Geyer SH, Mohun TJ, Rasskin-Gutman D, Matsui T, Ribeiro I, Costa LdF, Izpisua-Belmonte JC, Muller GB. High-resolution episcopic microscopy: a rapid technique for high detailed 3D analysis of gene activity in the context of tissue architecture and morphology. Anat Embryol (Berl) 2006;211:213–221. doi: 10.1007/s00429-005-0073-x. - DOI - PubMed
- Hsieh J. Computed Tomography – Principles, Design, Artifacts, and Recent Advances. Bellingham, Washington, USA: SPIE Press; 2003.
MeSH terms
Substances
LinkOut - more resources
Full Text Sources
Other Literature Sources
Medical
