Human Golgi antiapoptotic protein modulates intracellular calcium fluxes - PubMed (original) (raw)
. 2009 Aug;20(16):3638-45.
doi: 10.1091/mbc.e09-05-0385. Epub 2009 Jun 24.
Caroline Gubser, Michiel M T van Dommelen, Henk-Jan Visch, Felix Distelmaier, Antonio Postigo, Tomas Luyten, Jan B Parys, Humbert de Smedt, Geoffey L Smith, Peter H G M Willems, Frank J M van Kuppeveld
Affiliations
- PMID: 19553469
- PMCID: PMC2777924
- DOI: 10.1091/mbc.e09-05-0385
Human Golgi antiapoptotic protein modulates intracellular calcium fluxes
Fabrizio de Mattia et al. Mol Biol Cell. 2009 Aug.
Abstract
Golgi antiapoptotic protein (GAAP) is a novel regulator of cell death that is highly conserved in eukaryotes and present in some poxviruses, but its molecular mechanism is unknown. Given that alterations in intracellular Ca(2+) homeostasis play an important role in determining cell sensitivity to apoptosis, we investigated if GAAP affected Ca(2+) signaling. Overexpression of human (h)-GAAP suppressed staurosporine-induced, capacitative Ca(2+) influx from the extracellular space. In addition, it reduced histamine-induced Ca(2+) release from intracellular stores through inositol trisphosphate receptors. h-GAAP not only decreased the magnitude of the histamine-induced Ca(2+) fluxes from stores to cytosol and mitochondrial matrices, but it also reduced the induction and frequency of oscillatory changes in cytosolic Ca(2+). Overexpression of h-GAAP lowered the Ca(2+) content of the intracellular stores and decreased the efficacy of IP(3), providing possible explanations for the observed results. Opposite effects were obtained when h-GAAP was knocked down by siRNA. Thus, our data demonstrate that h-GAAP modulates intracellular Ca(2+) fluxes induced by both physiological and apoptotic stimuli.
Figures
Figure 1.
h-GAAP reduces staurosporine and histamine-induced Ca2+ rises in the cytosol and the mitochondria. (A and B) Fura-2 and rhod-2 coloaded cells were excited alternately at 380 and 540 nm for digital imaging microscopy of the STS (2 μM)-induced changes in rhod-2 (A) and fura-2 (B) fluorescence, respectively, in the absence or presence of 2-APB. STS was added at 120 s after the onset of monitoring. The fluorescence emission signal was normalized to its prestimulatory value. Typical records depicting changes in mitochondrial and cytosolic Ca2+ are shown (average of 13 cells is shown). In B, the scale representing the fura-2 380-nm fluorescence is inverted to give a more intuitive representation of the rise in cytosolic Ca2+. (C) Fura-2–loaded cells seeded on glass coverslips were treated with 100 μM histamine and changes in cytosolic Ca2+ were monitored by digital imaging microscopy. In each experiment, the fluorescence emission ratio was normalized to its prestimulatory value, which was set at 1. Left, typical records depicting changes in cytosolic Ca2+ (average of 30–40 cells is shown); right, the average ± SEM of the peak amplitude from three independent experiments performed in duplicate. * p < 0.05, *** p < 0.001. (D) Luminescence analysis of histamine-induced changes in Ca2+ concentration in the mitochondrial matrix of neo and GAAP cells transfected with mitochondrion-targeted aequorin. * p < 0.05. (E) IP3R expression levels in neo and h-GAAP cells lysates were determined by immunoblotting using an antibody recognizing all three IP3R isoforms. Proteins were resolved by using 4–15% linear gradient SDS-PAGE.
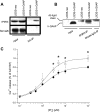
Figure 2.
h-GAAP coprecipitates with IP3R3, alters the sensitivity of the IP3-induced Ca2+ release response and increases the passive Ca2+ leakage from the stores. (A) h-GAAP (HA-tagged) was immunoprecipitated from h-GAAP cells using an anti-HA mAb. Immunoprecipitates were analyzed by immunoblotting using anti-IP3R subtype III (IP3R3) or anti-SERCA 2B mAbs. (B) IP3R3 was immunoprecipitated from neo and h-GAAP cells using an IP3R3 mAb or a IgG control Ab (IgG-IP). Immunoprecipitates were analyzed by immunoblotting using an anti-HA mAb. (C) Permeabilized neo or h-GAAP cells were loaded with 45Ca2+ for 45 min and then challenged with increasing concentrations of IP3. The IP3-induced Ca2+ release was counted, calculated relatively to maximal ionophore (A23187)-induced Ca2+ release, and plotted as a function of IP3 concentration. The IP3-insensitive Ca2+ passive leakage was subtracted from these values. Average values ± SD of three independent experiments performed in duplicate are shown. * p < 0.05, ** p < 0.01, *** p < 0.005.
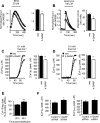
Figure 3.
h-GAAP reduces the Ca2+ filling state of the intracellular stores. (A and B) Fura-2–loaded cells were treated either with 20 μM BHQ (A) or 1 μM ionomycin (B) and changes in cytosolic Ca2+ were monitored as described in Figure 2C. Right panels, the average ± SEM of the peak amplitude (A) or integrated curve (B) from three independent experiments performed in duplicate. * p < 0.05. (C and D) Cells transfected with ER (C) and Golgi-targeted (D) aequorins were permeabilized with saponin, and then their Ca2+ uptake and content were determined by active loading of the stores in a perfusion medium containing ATP and 0.1 μM free Ca2+. Depicted are typical traces (left) and average ± SEM values of three or four measurements (right). ** p < 0.01. (E) Ca2+ content of the intracellular stores (average ± SEM) as analyzed by digital imaging microscopy at 20 and 40 h after transfection of the indicated siRNAs. The average Ca2+ content of siRNA control-transfected cells was set at 100%. *** p < 0.001. (F) Ca2+ filling state of the ER (left) and Golgi (right) in control siRNA and h-GAAP siRNA transfected cells as determined with targeted aequorins at 40 h after transfection. Average values ± SEM of four coverslips is shown. One of three representative experiments is shown. * p < 0.05.
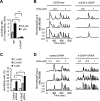
Figure 4.
h-GAAP reduces the sensitivity to hormonal induction of cytosolic Ca2+ oscillations and reduces their frequency. (A and B) Fura-2–loaded cells were stimulated with different concentrations of histamine at the indicated time and monitored for their Ca2+ response. (A) Average percentage of the responding cells (±SEM) that produce Ca2+ oscillations. ** p < 0.01. (B) Representative traces of three oscillating neo and three h-GAAP cells. (C and D) Fura-2–loaded cells transfected with either control siRNA or h-GAAP siRNA were stimulated with different concentrations of histamine at the indicated time and monitored for their Ca2+ response. (C) Representative histamine-induced Ca2+ oscillations of three cells transfected with either siRNA. (D) Average percentage of cells (±SEM) that respond with Ca2+ oscillations to the indicated histamine concentrations. * p < 0.05.
Similar articles
- Human and viral Golgi anti-apoptotic proteins (GAAPs) oligomerize via different mechanisms and monomeric GAAP inhibits apoptosis and modulates calcium.
Saraiva N, Prole DL, Carrara G, Maluquer de Motes C, Johnson BF, Byrne B, Taylor CW, Smith GL. Saraiva N, et al. J Biol Chem. 2013 May 3;288(18):13057-67. doi: 10.1074/jbc.M112.414367. Epub 2013 Mar 18. J Biol Chem. 2013. PMID: 23508950 Free PMC article. - Caspase-3-truncated type 1 inositol 1,4,5-trisphosphate receptor enhances intracellular Ca2+ leak and disturbs Ca2+ signalling.
Verbert L, Lee B, Kocks SL, Assefa Z, Parys JB, Missiaen L, Callewaert G, Fissore RA, De Smedt H, Bultynck G. Verbert L, et al. Biol Cell. 2008 Jan;100(1):39-49. doi: 10.1042/BC20070086. Biol Cell. 2008. PMID: 17868032 Free PMC article. - Cyclic AMP Recruits a Discrete Intracellular Ca2+ Store by Unmasking Hypersensitive IP3 Receptors.
Konieczny V, Tovey SC, Mataragka S, Prole DL, Taylor CW. Konieczny V, et al. Cell Rep. 2017 Jan 17;18(3):711-722. doi: 10.1016/j.celrep.2016.12.058. Cell Rep. 2017. PMID: 28099849 Free PMC article. - Inositol 1,4,5-trisphosphate receptors and their protein partners as signalling hubs.
Prole DL, Taylor CW. Prole DL, et al. J Physiol. 2016 Jun 1;594(11):2849-66. doi: 10.1113/JP271139. Epub 2016 Feb 24. J Physiol. 2016. PMID: 26830355 Free PMC article. Review. - Inositol 1,4,5-trisphosphate receptor-isoform diversity in cell death and survival.
Ivanova H, Vervliet T, Missiaen L, Parys JB, De Smedt H, Bultynck G. Ivanova H, et al. Biochim Biophys Acta. 2014 Oct;1843(10):2164-83. doi: 10.1016/j.bbamcr.2014.03.007. Epub 2014 Mar 15. Biochim Biophys Acta. 2014. PMID: 24642269 Review.
Cited by
- Golgi anti-apoptotic proteins are highly conserved ion channels that affect apoptosis and cell migration.
Carrara G, Saraiva N, Parsons M, Byrne B, Prole DL, Taylor CW, Smith GL. Carrara G, et al. J Biol Chem. 2015 May 1;290(18):11785-801. doi: 10.1074/jbc.M115.637306. Epub 2015 Feb 24. J Biol Chem. 2015. PMID: 25713081 Free PMC article. - hGAAP promotes cell adhesion and migration via the stimulation of store-operated Ca2+ entry and calpain 2.
Saraiva N, Prole DL, Carrara G, Johnson BF, Taylor CW, Parsons M, Smith GL. Saraiva N, et al. J Cell Biol. 2013 Aug 19;202(4):699-713. doi: 10.1083/jcb.201301016. Epub 2013 Aug 12. J Cell Biol. 2013. PMID: 23940116 Free PMC article. - Identification of Zebrafish Calcium Toolkit Genes and their Expression in the Brain.
Wasilewska I, Gupta RK, Palchevska O, Kuźnicki J. Wasilewska I, et al. Genes (Basel). 2019 Mar 18;10(3):230. doi: 10.3390/genes10030230. Genes (Basel). 2019. PMID: 30889933 Free PMC article. - Regulation of BCR-mediated Ca2+ mobilization by MIZ1-TMBIM4 safeguards IgG1+ GC B cell-positive selection.
Zhang L, Toboso-Navasa A, Gunawan A, Camara A, Nakagawa R, Finsterbusch K, Chakravarty P, Newman R, Zhang Y, Eilers M, Wack A, Tolar P, Toellner KM, Calado DP. Zhang L, et al. Sci Immunol. 2024 Apr 5;9(94):eadk0092. doi: 10.1126/sciimmunol.adk0092. Epub 2024 Apr 5. Sci Immunol. 2024. PMID: 38579014 Free PMC article. - Downregulation of type 3 inositol (1,4,5)-trisphosphate receptor decreases breast cancer cell migration through an oscillatory Ca2+ signal.
Mound A, Vautrin-Glabik A, Foulon A, Botia B, Hague F, Parys JB, Ouadid-Ahidouch H, Rodat-Despoix L. Mound A, et al. Oncotarget. 2017 Aug 18;8(42):72324-72341. doi: 10.18632/oncotarget.20327. eCollection 2017 Sep 22. Oncotarget. 2017. PMID: 29069790 Free PMC article.
References
- Berridge M. J., Bootman M. D., Roderick H. L. Calcium signalling: dynamics, homeostasis and remodelling. Nat. Rev. Mol. Cell Biol. 2003;4:517–529. - PubMed
- Boehning D., Patterson R. L., Sedaghat L., Glebova N. O., Kurosaki T., Snyder S. H. Cytochrome c binds to inositol (1,4,5) trisphosphate receptors, amplifying calcium-dependent apoptosis. Nat. Cell Biol. 2003;5:1051–1061. - PubMed
- Dolman N. J., Gerasimenko J. V., Gerasimenko O. V., Voronina S. G., Petersen O. H., Tepikin A. V. Stable Golgi-mitochondria complexes and formation of Golgi Ca(2+) gradients in pancreatic acinar cells. J. Biol. Chem. 2005;280:15794–15799. - PubMed
Publication types
MeSH terms
Substances
LinkOut - more resources
Full Text Sources
Molecular Biology Databases
Miscellaneous


