Arrestin2/clathrin interaction is regulated by key N- and C-terminal regions in arrestin2 - PubMed (original) (raw)
Arrestin2/clathrin interaction is regulated by key N- and C-terminal regions in arrestin2
Ronald C Kern et al. Biochemistry. 2009.
Abstract
The interaction of nonvisual arrestins with clathrin is an important step in mediating the endocytosis of cell surface receptors. Previous studies have shown that mutation of the clathrin-binding box in arrestin leads to severe defects in arrestin-mediated trafficking. However, little is known about how arrestin/clathrin interaction is regulated. Here we show that both the N- and C-terminal regions of arrestin2 function to inhibit basal interaction with clathrin. Truncation analysis revealed that clathrin binding increases as the C-tail of arrestin2 is shortened while site-directed mutagenesis identified Glu-404, Glu-405, and Glu-406 as being primarily responsible for this inhibition. Mutagenesis also identified Lys-4, Arg-7, Lys-10, and Lys-11 within the N-terminus as playing a key role in regulating clathrin binding. Based on similarities with visual arrestin, Lys-10 and Lys-11 likely function as phospho sensors in arrestin2 to initially discriminate the phosphorylation status of target receptors. Analysis of the arrestin2 structure reveals that Arg-7, Lys-10, and Lys-11 are in close proximity to Glu-389 and Asp-390, suggesting that these residues may form intramolecular interactions. In fact, simultaneous mutation of Glu-389 and Asp-390 also leads to enhanced clathrin binding. These results reveal that multiple intramolecular interactions coordinately regulate arrestin2 interaction with clathrin, highlighting this interaction as a critical step in regulating receptor trafficking.
Figures
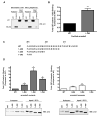
Figure 1. The C-terminal tail of arrestin2 regulates clathrin binding
(A) GST pulldowns were performed using 100 pmol GST-clathrin-(1-363) or 100 pmol GST-β2-adaptin (700-937) and 100 μg of Cos 1 lysate overexpressing wild type arrestin2 or arrestin2 319-418. (B) GST pulldowns were performed using 100 pmol GST-clathrin-(1-363) and 10 pmol purified wild type or truncated arrestin2. Bars represent the mean ± S.E. from 10 independent experiments. (C) Sequence of the arrestin2 truncations used in the binding assays. (D) GST pulldowns were performed using 100 pmol GST-clathrin-(1-363) (left panel) or 100 pmol GST-β2-adaptin (700-937) (right panel) and 100 μg of Cos 1 cell lysate overexpressing wild type or truncated arrestin2. Bound arrestins were eluted, separated on a 10% SDS-PAGE gel, transferred to nitrocellulose, and probed with an arrestin polyclonal antibody, followed by an AlexaFluor 680 conjugated secondary antibody. Blots were quantitated using a Licor Odyssey scanner, and the amount of arrestin2 bound to GST-clathrin-(1-363) was normalized to the level of arrestin overexpression. Binding to various arrestin2 mutants was compared to full length arrestin2 (set to 1). Representative western blots showing binding and arrestin expression (input) are shown. Bars represent the mean ± S.E. from 9 independent experiments. Statistical analysis was preformed using a paired t test (*, p < 0.05, **, p < 0.005, ***, p < 0.0005 versus full length).
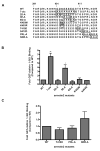
Figure 2. The acidic patch contains key residues involved in regulating clathrin binding
(A) Sequences of the arrestin2 C-tail mutations used in the binding assays. Residues characterized in this study are boxed. (B) Analysis of the role of the ‘acidic patch’ in regulating clathrin binding. (C) Analysis of the role of the extreme C-tail in regulating clathrin binding. GST pulldowns were performed using 100 pmol GST-clathrin-(1-363) and 100 μg of Cos 1 cell lysate overexpressing wild type or mutant arrestin2 as described in Materials and Methods. Bars represent the mean ± S.E. from 4–6 independent experiments. Statistical analysis was preformed using a paired t test (*, p < 0.05, **, p < 0.005 versus full length).
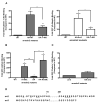
Figure 3. Analysis of the arrestin2-S412 mutants on clathrin binding
(A) GST pulldowns were performed using 100 pmol GST-clathrin-(1-363) (left panel) or GST-β2-adaptin (700-937) (right panel) and 10 pmol purified arrestin2. (B) GST pulldowns were performed using 100 pmol GST-clathrin-(1-363) and 100 μg of Cos 1 cell lysate overexpressing wild type or mutant arrestin2 as described in Materials and Methods. Bars represent the mean ± S.E. from 6–9 independent experiments. Statistical analysis was preformed using a paired t test (**, p < 0.005, ***, p < 0.0005 versus full length).
Figure 4. Arrestin2 ‘activation’ relieves inhibitory constraints of the C-tail
Effect of the R169E mutation on the binding of arrestin2-S412D to GST-clathrin-(1-363). GST pulldowns were performed using 100 pmol GST-clathrin-(1-363) and 100 μg of Cos 1 cell lysate overexpressing wild type or mutant arrestin2. Representative western blot (left panel) and quantitation (right panel) are shown. Bars represent the mean ± S.E. from 6–8 independent experiments. Statistical analysis was preformed using a paired t test (*, p < 0.05, **, p < 0.005 versus full length). (B) Effect of the R169E mutation on the binding of C-terminally truncated arrestin2 to GST-clathrin-(1-363). GST pulldowns were performed using 100 pmol GST-clathrin-(1-363) and 100 μg of Cos 1 cell lysate overexpressing wild type or mutant arrestin2. Arrestin2 binding (upper panel) and input (lower panel) are shown.
Figure 5. Addition of an N-terminal HA-tag increases binding of arrestin2 to clathrin
(A) Effect of an N-terminal HA-tag on binding of full length arrestin2 or arrestin2-(1-400) to GST-clathrin-(1-363) (left panel) or GST-β2-adaptin-(700-937) (right panel). The bars represent the mean ± S.E. from 3 independent experiments. (B) Effect of the R169E mutation on HA-arrestin2 binding to GST-clathrin-(1-363). Bars represent the mean ± S.E. from 5 independent experiments. (C) Comparison of untagged vs. HA-tagged arrestin3 binding to GST-clathrin-(1-363). Bars represent the mean ± S.E. from 10 independent experiments. (D) Alignment of the arrestin2 and arrestin3 N- and C-terminal regions. Statistical analysis was performed using a paired t test (*, p < 0.05, **, p < 0.005 versus full length).
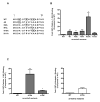
Figure 6. The arrestin2 N-terminus regulates clathrin binding
(A) Sequences of the arrestin2 N-terminal mutations used in the binding assays. Residues characterized in this study are boxed. (B) GST pulldowns were performed using 100 pmol GST-clathrin-(1-363) and 100 μg of Cos 1 cell lysate containing wild type or mutant arrestin2. (C) Analysis of the arrestin2 Lys-10 mutant binding to GST-clathrin-(1-363) (left panel) or GST-β2-adaptin-(700-937) (right panel). Bars represent the mean ± S.E. from 4–6 independent experiments. Statistical analysis was preformed using a paired t test (*, p < 0.05, **, p < 0.005 versus full length).
Figure 7. Modeling and binding analysis of Lys-10 and Lys-11 interactions
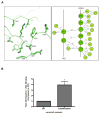
(A) Structure of arrestin2 highlighting residues surrounding Lys-10 and Lys-11 (left panel). Color of residues is as follows: nitrogen = blue and oxygen = red. Model of predicted intramolecular interactions formed between the N-terminus and the C-terminal tail (right panel). Bold dotted lines represent potential hydrophobic interactions, while smaller dotted lines represent potential hydrogen bonds. The distances between residues are noted in angstroms. (B) GST pulldowns were performed using 100 pmol GST-clathrin-(1-363) and 100 μg of Cos 1 cell lysate containing wild type or mutant arrestin2. Bars represent the mean ± S.E. from 5 independent experiments. Statistical analysis was preformed using a paired t test (**, p < 0.005 versus full length).
Figure 8. Internalization of β2AR in Cos 1 cells overexpressing wild type and mutant arrestin2
Cos 1 cells were transiently transfected with Flag-β2AR and wild type or mutant arrestin2. Forty eight hr post-transfection the cells were treated with or without 10 μM isoproterenol for 5, 10, or 20 min at 37°C. β2AR internalization was measured by ELISA as described under “Materials and Methods.” Bars represent the mean ± S.E. from 6–10 independent experiments. Statistical analysis was preformed using a paired t test (**, p < 0.005, ***, p < 0.0005 versus wild type).
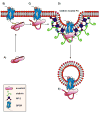
Figure 9. Model of the regulation of the basal arrestin2/clathrin interaction
A) In the basal state, the N-terminus and C-tail form various intramolecular interactions within arrestin2. The phosphate group at Ser-412 helps stabilize these interactions. In this state, the loop that contains the clathrin-binding box is in a ‘closed’ conformation and is inaccessible to clathrin binding. B) Upon receptor binding, the phosphate groups on the receptor bind to Lys-10 and Lys-11, disrupting the intramolecular interactions involving the N-terminus, leading to an ‘intermediate’ state that exhibits increased clathrin binding. In this state, however, the C-tail is still inaccessible and clathrin binding is not maintained. C) The phosphate groups are guided into the polar core resulting in a conformational change that disrupts the intramolecular interactions involving the C-tail. The C-tail becomes fully extended ‘opening’ the loop and the clathrin-binding site. Arrestin is now able to recruit the GPCR to clathrin-coated pits via clathrin and AP-2 binding. D) In the clathrin-coated pit, the clathrin-binding box engages the clathrin terminal domain, while the C-tail of arrestin binds to β2-adaptin. E) The receptor is internalized.
Similar articles
- Structure of an arrestin2-clathrin complex reveals a novel clathrin binding domain that modulates receptor trafficking.
Kang DS, Kern RC, Puthenveedu MA, von Zastrow M, Williams JC, Benovic JL. Kang DS, et al. J Biol Chem. 2009 Oct 23;284(43):29860-72. doi: 10.1074/jbc.M109.023366. Epub 2009 Aug 25. J Biol Chem. 2009. PMID: 19710023 Free PMC article. - Arrestin/clathrin interaction. Localization of the arrestin binding locus to the clathrin terminal domain.
Goodman OB Jr, Krupnick JG, Gurevich VV, Benovic JL, Keen JH. Goodman OB Jr, et al. J Biol Chem. 1997 Jun 6;272(23):15017-22. doi: 10.1074/jbc.272.23.15017. J Biol Chem. 1997. PMID: 9169477 - Arrestin/clathrin interaction. Localization of the clathrin binding domain of nonvisual arrestins to the carboxy terminus.
Krupnick JG, Goodman OB Jr, Keen JH, Benovic JL. Krupnick JG, et al. J Biol Chem. 1997 Jun 6;272(23):15011-6. doi: 10.1074/jbc.272.23.15011. J Biol Chem. 1997. PMID: 9169476 - Differential roles of arrestin-2 interaction with clathrin and adaptor protein 2 in G protein-coupled receptor trafficking.
Kim YM, Benovic JL. Kim YM, et al. J Biol Chem. 2002 Aug 23;277(34):30760-8. doi: 10.1074/jbc.M204528200. Epub 2002 Jun 17. J Biol Chem. 2002. PMID: 12070169 - β-Arrestins and G protein-coupled receptor trafficking.
Kang DS, Tian X, Benovic JL. Kang DS, et al. Methods Enzymol. 2013;521:91-108. doi: 10.1016/B978-0-12-391862-8.00005-3. Methods Enzymol. 2013. PMID: 23351735 Review.
Cited by
- Arrestin-2 interacts with the endosomal sorting complex required for transport machinery to modulate endosomal sorting of CXCR4.
Malik R, Marchese A. Malik R, et al. Mol Biol Cell. 2010 Jul 15;21(14):2529-41. doi: 10.1091/mbc.e10-02-0169. Epub 2010 May 26. Mol Biol Cell. 2010. PMID: 20505072 Free PMC article. - A phosphotyrosine switch for cargo sequestration at clathrin-coated buds.
Chakraborty S, Umasankar PK, Preston GM, Khandelwal P, Apodaca G, Watkins SC, Traub LM. Chakraborty S, et al. J Biol Chem. 2014 Jun 20;289(25):17497-514. doi: 10.1074/jbc.M114.556589. Epub 2014 May 5. J Biol Chem. 2014. PMID: 24798335 Free PMC article. - Fluorescence correlation spectroscopy, combined with bimolecular fluorescence complementation, reveals the effects of β-arrestin complexes and endocytic targeting on the membrane mobility of neuropeptide Y receptors.
Kilpatrick LE, Briddon SJ, Holliday ND. Kilpatrick LE, et al. Biochim Biophys Acta. 2012 Jun;1823(6):1068-81. doi: 10.1016/j.bbamcr.2012.03.002. Epub 2012 Mar 8. Biochim Biophys Acta. 2012. PMID: 22487268 Free PMC article. - Distinct G protein-coupled receptor phosphorylation motifs modulate arrestin affinity and activation and global conformation.
Mayer D, Damberger FF, Samarasimhareddy M, Feldmueller M, Vuckovic Z, Flock T, Bauer B, Mutt E, Zosel F, Allain FHT, Standfuss J, Schertler GFX, Deupi X, Sommer ME, Hurevich M, Friedler A, Veprintsev DB. Mayer D, et al. Nat Commun. 2019 Mar 19;10(1):1261. doi: 10.1038/s41467-019-09204-y. Nat Commun. 2019. PMID: 30890705 Free PMC article. - Structure of an arrestin2-clathrin complex reveals a novel clathrin binding domain that modulates receptor trafficking.
Kang DS, Kern RC, Puthenveedu MA, von Zastrow M, Williams JC, Benovic JL. Kang DS, et al. J Biol Chem. 2009 Oct 23;284(43):29860-72. doi: 10.1074/jbc.M109.023366. Epub 2009 Aug 25. J Biol Chem. 2009. PMID: 19710023 Free PMC article.
References
- Lefkowitz RJ, Shenoy SK. Transduction of receptor signals by β-arrestins. Science. 2005;308:512–517. - PubMed
- Gutkind JS. The pathways connecting G protein-coupled receptors to the nucleus through divergent mitogen-activated protein kinase cascades. J Biol Chem. 1998;273:1839–1842. - PubMed
- Krupnick JG, Benovic JL. The role of receptor kinases and arrestins in G protein-coupled receptor regulation. Annu Rev Pharmacol Toxicol. 1998;38:289–319. - PubMed
- Moore CA, Milano SK, Benovic JL. Regulation of receptor trafficking by GRKs and arrestins. Annu Rev Physiol. 2007;69:451–482. - PubMed
- DeWire SM, Ahn S, Lefkowitz RJ, Shenoy SK. β-arrestins and cell signaling. Annu Rev Physiol. 2007;69:483–510. - PubMed
Publication types
MeSH terms
Substances
Grants and funding
- GM47417/GM/NIGMS NIH HHS/United States
- R37 GM047417-16/GM/NIGMS NIH HHS/United States
- R01 GM068857/GM/NIGMS NIH HHS/United States
- GM68857/GM/NIGMS NIH HHS/United States
- R01 GM068857-03/GM/NIGMS NIH HHS/United States
- R37 GM047417/GM/NIGMS NIH HHS/United States
- R37 GM047417-15/GM/NIGMS NIH HHS/United States
- R01 GM068857-04/GM/NIGMS NIH HHS/United States
- R37 GM047417-14/GM/NIGMS NIH HHS/United States
- R37 GM047417-15S1/GM/NIGMS NIH HHS/United States
- R01 GM047417/GM/NIGMS NIH HHS/United States
LinkOut - more resources
Full Text Sources
Other Literature Sources
