Mitochondrial STAT3 supports Ras-dependent oncogenic transformation - PubMed (original) (raw)
Mitochondrial STAT3 supports Ras-dependent oncogenic transformation
Daniel J Gough et al. Science. 2009.
Abstract
Signal transducer and activator of transcription 3 (STAT3) is a latent cytoplasmic transcription factor responsive to cytokine signaling and tyrosine kinase oncoproteins by nuclear translocation when it is tyrosine-phosphorylated. We report that malignant transformation by activated Ras is impaired without STAT3, in spite of the inability of Ras to drive STAT3 tyrosine phosphorylation or nuclear translocation. Moreover, STAT3 mutants that cannot be tyrosine-phosphorylated, that are retained in the cytoplasm, or that cannot bind DNA nonetheless supported Ras-mediated transformation. Unexpectedly, STAT3 was detected within mitochondria, and exclusive targeting of STAT3 to mitochondria without nuclear accumulation facilitated Ras transformation. Mitochondrial STAT3 sustained altered glycolytic and oxidative phosphorylation activities characteristic of cancer cells. Thus, in addition to its nuclear transcriptional role, STAT3 regulates a metabolic function in mitochondria, supporting Ras-dependent malignant transformation.
Figures
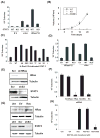
Figure 1. STAT3 is essential for Ras transformation but not as a transcription factor
(A) Colony formation of wild type (WT) or STAT3-deficient (KO) cells with or without v-Src or H-RasV12 plated in soft agar. (B) Average tumor volume formed by H-RasV12-expressing STAT3-null cells transduced with empty vector (KO), wild type (WT) or Y705F-mutant STAT3 (Y705F) and injected into Balb/cnu/nu mice (5 mice per group). (C) Average colony formation of H-RasV12-expressing STAT3-deficient cells stably transduced with empty vector (EV), wild type STAT3 (WT), or STAT3 mutants: N-terminal 132 amino acid deletion (ΔN), DNA binding domain VVV461-463AAA (DBD), SH2 domain R609K (SH2), tyrosine phosphorylation site Y705F (YF), serine phosphorylation site S727A and S727D (SA and SD), and the STAT3β isoform (β). (D) Average colony formation of H-RasV12 or v-Src-expressing cells transduced with empty vector (EV), wild type STAT3 (WT), or STAT3 with a mutated nuclear localization signal (NLS). (E) Depletion of H-Ras or STAT3 protein by shRNA in T24 human bladder carcinoma cells compared to scrambled shRNA control (Scr). (F) Average colony formation of T24 cells depleted for STAT3 or H-Ras. (G) Expression of H-Ras and STAT3 in human breast epithelial MCF10A cells transduced with empty vector (EV) or H-RasV12 (Ras) and transfected with shRNA to STAT3 (shS3) or scrambled control (Scr). (H) Average colony formation of MCF10A cells with and without H-RasV12 and STAT3. Error bars indicate SD.
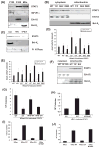
Figure 2. Localization of STAT3 to mitochondria supports Ras transformation
(A) Fractionation of cells mechanically disrupted in absence of detergent and separated into P100 (plasma membrane), S100 (organelle-free cytosol), and mitochondrial fractions. Samples probed for STAT3, IGF1-R1α, or Bcl-XL, as indicated. (B) Distribution of STAT3 mutants expressed in H-RasV12-transduced cells. Erk1/2 and Bcl-XL expression verified fraction purity. (C) Protease-sensitivity of proteins associated with mitochondrial membranes in absence (unt) or presence of proteinase K (+PK) or proteinase K and Triton X-100 (+PK/T). (D) Survival of H-RasV12 expressing cells following glucose depletion. Survival of STAT3-null (KO) or wild type cells expressing H-RasV12 (WT) or STAT3-null cells expressing H-RasV12 reconstituted with empty vector (EV) or STAT3 mutants after growth in low or high glucose medium, as indicated. Asterisks indicate statistically significant differences (p<.05 by student’s t-test) of individual conditions relative to empty vector. (E) Survival of cells exposed to 2% oxygen. (F) Mitochondrially-targeted wild type and mutant STAT3 protein expression. (G) Colony formation by H-RasV12-, (H) v-Src-, and (I, J) N- and K-Ras-expressing cell lines.
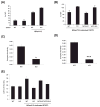
Figure 3. Mitochondrial STAT3 augments electron transport chain activity
(A) Mitochondrial membrane potential measured with TMRE and recorded as mean fluorescence intensity (MFI) by flow cytometry in wild type (WT) or STAT3-deficient (KO) cells with or without H-RasV12. (B) Mitochondrial membrane potential of H-RasV12-expressing cells with wild type (WT), vector (KO), mitochondrially-targeted wild type (MTS-WT) or S727A-mutant STAT3. Activities of electron transport chain complexes II (C) and V (D) compared between H-RasV12-expressing wild type (WT) or STAT3-deficient (KO) cells. Unit activity of individual complexes normalized to citrate synthase activity from equivalent numbers of mitochondria. Statistical significance with p value <0.05* or <0.001*** by student’s t-test. (E) Lactate dehydrogenase activity in wild type (WT), STAT3-deficient (KO), and H-RasV12-expressing wild type (WT), STAT3-deficient (KO), mitochondrially-targeted wild type (MTS-WT), or mutant STAT3 (MTS-S/A) expressing cells. Results are means of 3 replicates. Error bars indicate SD.
Similar articles
- STAT3 revs up the powerhouse.
Reich NC. Reich NC. Sci Signal. 2009 Sep 29;2(90):pe61. doi: 10.1126/scisignal.290pe61. Sci Signal. 2009. PMID: 19797267 Review. - STAT3 supports experimental K-RasG12D-induced murine myeloproliferative neoplasms dependent on serine phosphorylation.
Gough DJ, Marié IJ, Lobry C, Aifantis I, Levy DE. Gough DJ, et al. Blood. 2014 Oct 2;124(14):2252-61. doi: 10.1182/blood-2013-02-484196. Epub 2014 Aug 22. Blood. 2014. PMID: 25150294 Free PMC article. - Mitochondrial STAT3 contributes to transformation of Barrett's epithelial cells that express oncogenic Ras in a p53-independent fashion.
Yu C, Huo X, Agoston AT, Zhang X, Theiss AL, Cheng E, Zhang Q, Zaika A, Pham TH, Wang DH, Lobie PE, Odze RD, Spechler SJ, Souza RF. Yu C, et al. Am J Physiol Gastrointest Liver Physiol. 2015 Aug 1;309(3):G146-61. doi: 10.1152/ajpgi.00462.2014. Epub 2015 Jun 4. Am J Physiol Gastrointest Liver Physiol. 2015. PMID: 26045618 Free PMC article. - A Synthetic Lethal Interaction between Glutathione Synthesis and Mitochondrial Reactive Oxygen Species Provides a Tumor-Specific Vulnerability Dependent on STAT3.
Garama DJ, Harris TJ, White CL, Rossello FJ, Abdul-Hay M, Gough DJ, Levy DE. Garama DJ, et al. Mol Cell Biol. 2015 Nov;35(21):3646-56. doi: 10.1128/MCB.00541-15. Epub 2015 Aug 17. Mol Cell Biol. 2015. PMID: 26283727 Free PMC article. - STAT3-Mediated Metabolic Reprograming in Cellular Transformation and Implications for Drug Resistance.
Poli V, Camporeale A. Poli V, et al. Front Oncol. 2015 Jun 8;5:121. doi: 10.3389/fonc.2015.00121. eCollection 2015. Front Oncol. 2015. PMID: 26106584 Free PMC article. Review.
Cited by
- The Role of IL-6 in Cancer Cell Invasiveness and Metastasis-Overview and Therapeutic Opportunities.
Rašková M, Lacina L, Kejík Z, Venhauerová A, Skaličková M, Kolář M, Jakubek M, Rosel D, Smetana K Jr, Brábek J. Rašková M, et al. Cells. 2022 Nov 21;11(22):3698. doi: 10.3390/cells11223698. Cells. 2022. PMID: 36429126 Free PMC article. Review. - The expression of the receptor for advanced glycation endproducts (RAGE) is permissive for early pancreatic neoplasia.
Kang R, Loux T, Tang D, Schapiro NE, Vernon P, Livesey KM, Krasinskas A, Lotze MT, Zeh HJ 3rd. Kang R, et al. Proc Natl Acad Sci U S A. 2012 May 1;109(18):7031-6. doi: 10.1073/pnas.1113865109. Epub 2012 Apr 16. Proc Natl Acad Sci U S A. 2012. PMID: 22509024 Free PMC article. - The FGFR4-G388R polymorphism promotes mitochondrial STAT3 serine phosphorylation to facilitate pituitary growth hormone cell tumorigenesis.
Tateno T, Asa SL, Zheng L, Mayr T, Ullrich A, Ezzat S. Tateno T, et al. PLoS Genet. 2011 Dec;7(12):e1002400. doi: 10.1371/journal.pgen.1002400. Epub 2011 Dec 8. PLoS Genet. 2011. PMID: 22174695 Free PMC article. - IL1- and TGFβ-Nox4 signaling, oxidative stress and DNA damage response are shared features of replicative, oncogene-induced, and drug-induced paracrine 'bystander senescence'.
Hubackova S, Krejcikova K, Bartek J, Hodny Z. Hubackova S, et al. Aging (Albany NY). 2012 Dec;4(12):932-51. doi: 10.18632/aging.100520. Aging (Albany NY). 2012. PMID: 23385065 Free PMC article. - VISTA promotes the metabolism and differentiation of myeloid-derived suppressor cells by STAT3 and polyamine-dependent mechanisms.
Zhang K, Zakeri A, Alban T, Dong J, Ta HM, Zalavadia AH, Branicky A, Zhao H, Juric I, Husich H, Parthasarathy PB, Rupani A, Drazba JA, Chakraborty AA, Ching-Cheng Huang S, Chan T, Avril S, Wang LL. Zhang K, et al. Cell Rep. 2024 Jan 23;43(1):113661. doi: 10.1016/j.celrep.2023.113661. Epub 2024 Jan 3. Cell Rep. 2024. PMID: 38175754 Free PMC article.
References
- Levy DE, Darnell JE., Jr Nat Rev Mol Cell Biol. 2002;3:651. - PubMed
- Zhong Z, Wen Z, Darnell JE. Science. 1994;264:95. - PubMed
- Raz R, Durbin JE, Levy DE. J Biol Chem. 1994;269:24391. - PubMed
- Lütticken C, et al. Science. 1994;263:89. - PubMed
Publication types
MeSH terms
Substances
LinkOut - more resources
Full Text Sources
Other Literature Sources
Miscellaneous


