Altered regulation of metabolic pathways in human lung cancer discerned by (13)C stable isotope-resolved metabolomics (SIRM) - PubMed (original) (raw)
Altered regulation of metabolic pathways in human lung cancer discerned by (13)C stable isotope-resolved metabolomics (SIRM)
Teresa W M Fan et al. Mol Cancer. 2009.
Abstract
Background: Metabolic perturbations arising from malignant transformation have not been systematically characterized in human lung cancers in situ. Stable isotope resolved metabolomic analysis (SIRM) enables functional analysis of gene dysregulations in lung cancer. To this purpose, metabolic changes were investigated by infusing uniformly labeled 13C-glucose into human lung cancer patients, followed by resection and processing of paired non-cancerous lung and non small cell carcinoma tissues. NMR and GC-MS were used for 13C-isotopomer-based metabolomic analysis of the extracts of tissues and blood plasma.
Results: Many primary metabolites were consistently found at higher levels in lung cancer tissues than their surrounding non-cancerous tissues. 13C-enrichment in lactate, Ala, succinate, Glu, Asp, and citrate was also higher in the tumors, suggesting more active glycolysis and Krebs cycle in the tumor tissues. Particularly notable were the enhanced production of the Asp isotopomer with three 13C-labeled carbons and the buildup of 13C-2,3-Glu isotopomer in lung tumor tissues. This is consistent with the transformations of glucose into Asp or Glu via glycolysis, anaplerotic pyruvate carboxylation (PC), and the Krebs cycle. PC activation in tumor tissues was also shown by an increased level of pyruvate carboxylase mRNA and protein.
Conclusion: PC activation - revealed here for the first time in human subjects - may be important for replenishing the Krebs cycle intermediates which can be diverted to lipid, protein, and nucleic acid biosynthesis to fulfill the high anabolic demands for growth in lung tumor tissues. We hypothesize that this is an important event in non-small cell lung cancer and possibly in other tumor development.
Figures
Figure 1
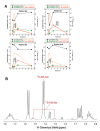
Plasma samples were collected 0, 3 and 12 hr after [U-13C-Glc] infusion, as described in the Experimental Section. Unlabeled glucose and lactate concentrations were quantified by 1-D 1H NMR using DSS as the calibration standard. Their % 13C enrichment was determined from the respective 13C satellite peaks in 1-D 1H NMR spectra. Panel A illustrates the time course changes in glucose and lactate concentrations as well as their % 13C enrichment. Panel B shows the 13C satellite pattern of the 3-methyl group of lactate (13C-CH3-lac) in the 1-D 1H NMR spectrum of patient #6 after 3 hr of [U-13C-Glc] infusion. The chemical shifts of lactate and Ala reflected the acidic pH of the TCA extract.
Figure 2
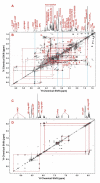
2-D 1H TOCSY identification of polar metabolites in the lung tumor tissue of patient #6. The 2-D TOCSY contour map is displayed along with the corresponding 1-D high-resolution spectrum. Panels A, B and C, D show the 0.8–6.4 and 5.7–9.5 ppm regions of the spectra, respectively. The assignment of cystine residue of oxidized glutathione (GSSG) was illustrated, which was based on the 1H covalent connectivity (traced by solid rectangles) and chemical shifts (traced by dashed blue lines). Lactate was discerned similarly and based on the peak splitting pattern (doublet for 3-methyl @ 1.32 ppm and quartet for 2-methine protons @ 4.11 ppm). In addition, the 13C satellite cross-peaks of 3-methyl and 2-methine protons of lactate (patterns 1 and 2) and Ala (patterns 3 and 4) were evident (traced by dashed green rectangles), and the peak pattern indicates that lactate and Ala were uniformly 13C labeled [19]. The 13C satellite cross-peak patterns for the protons of Glu (5, 6, 12, 20), Gln (9), glutamyl residue of oxidized glutathione (GSSG) (7, 10, 13) and Asp (16–19) were present and noted by vertical and horizontal dashed green lines. The 13C satellite cross-peaks 14 and 15 were contributed by a mixture of 13C-2-Glu, 13C-2-Gln, and 13C-2-Glu of reduced glutathione (GSH).
Figure 3
1H-13C 2-D HSQC identification of 13C-metabolites in the TCA extracts of lung tumor tissues of patient #6. Metabolites were identified based on 1H-13C covalent linkages observed in the 2-D contour map (panel B) and from the TOCSY spectrum such as in Fig. 2B. Panel A is the 1-D projection spectrum of the 2-D data along the 13C dimension, which allows a better comparison of the peak intensity of different metabolites. Panel C displays the expanded spectral region of C3 and C4 resonances of Glu, Gln, and GSSG-Glu to illustrate the resolution of these resonances in the 2-D HSQC contour map.
Figure 4
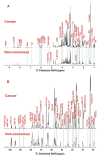
Comparison of metabolite profiles in TCA extracts of paired non-cancerous and cancerous lung tissues of patient #6. Metabolites in the 1-D 1H NMR (panel A) and 13C HSQC projection spectra (panel B) were assigned as in Fig. 2 and 3, respectively. The two sets of spectra were normalized to dry weight and spectral parameters such that the peak intensity of individual resonances is directly comparable. The dashed lines trace metabolites that differed in abundance between cancerous and non-cancerous lung tissues.
Figure 5
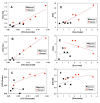
Relationships between Krebs cycle intermediates and glycolytic products in terms of 13C-labeled and total concentrations for lung tumor and non-cancerous tissues resected from patients #6–10. Metabolite and 13C isotopomer concentrations ([metabolite]) were determined from GC-MS analysis as described in Methods. The R2 of the linear fit (solid red lines for cancer and dash black lines for non-cancerous tissues) for these plots are listed in Table 4.
Figure 6
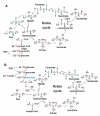
Expected 13C labeling patterns in mitochondrial Krebs cycle intermediates and byproducts with [U-13C]-Glc as tracer. The cycle reactions are depicted without (panel A) or with (panel B) anaplerotic pyruvate carboxylase (PC) reaction and the 13C positional isotopomer patterns illustrated are the result of one cycle turn. In the absence of pyruvate carboxylation, Glu is labeled at C4 and C5 positions via the forward cycle reactions while Glu is labeled at C2 and C3 when pyruvate carboxylation is active (panels A and B). The possibility that a separate pool of pyruvate derived from Ala for entry into the Krebs cycle via pyruvate carboxylation is depicted in panel B, along with the contribution of the non-oxidative branch of the pentose phosphate pathway (PPP) to the pyruvate pool. Isotopic scrambling occurs at the symmetric succinate, leading to the redistribution of 13C labels into its four carbons, two each at a time (blue and green carbons). Red or blue and green letter C's represent 13C labeled carbons before or after scrambling, respectively; blue pyruvate denotes a separate pool of pyruvate; solid and dashed arrows denote favorable single and multi-step reactions, respectively; open arrows in panel A delineate 13C-labeled OAA after one turn from unlabeled pre-existing OAA.
Figure 7
Western blot analysis of PC protein patterns of paired tumor and non-cancerous tissues from patients #6–10. Western blotting (panel A) and image analysis (panel B) were performed as described in Methods. Normalized PC response represented PC image density normalized to α-tubulin image density. The non-cancerous tissue of patient #8 had a high interfering background with no discernable PC band in the blot image, which was not quantified. The cancer tissue of patient #10 had a very intense PC band, which along with the PC band of the non-cancerous tissue was quantified using the blot image with 2 min of film exposure, as was the case for the α-tubulin band of all tissues. PC band for the rest of tissues was quantified using the same blot but with 17 min of film exposure. N: non-cancerous; C: cancer; ND: not determined. The data shown is representative of two separate blot analyses.
Similar articles
- Chloroformate derivatization for tracing the fate of Amino acids in cells and tissues by multiple stable isotope resolved metabolomics (mSIRM).
Yang Y, Fan TW, Lane AN, Higashi RM. Yang Y, et al. Anal Chim Acta. 2017 Jul 11;976:63-73. doi: 10.1016/j.aca.2017.04.014. Epub 2017 Apr 10. Anal Chim Acta. 2017. PMID: 28576319 Free PMC article. - Isotopomer studies of gluconeogenesis and the Krebs cycle with 13C-labeled lactate.
Katz J, Wals P, Lee WN. Katz J, et al. J Biol Chem. 1993 Dec 5;268(34):25509-21. J Biol Chem. 1993. PMID: 7902352 - Pyruvate carboxylase is critical for non-small-cell lung cancer proliferation.
Sellers K, Fox MP, Bousamra M 2nd, Slone SP, Higashi RM, Miller DM, Wang Y, Yan J, Yuneva MO, Deshpande R, Lane AN, Fan TW. Sellers K, et al. J Clin Invest. 2015 Feb;125(2):687-98. doi: 10.1172/JCI72873. Epub 2015 Jan 20. J Clin Invest. 2015. PMID: 25607840 Free PMC article. Clinical Trial. - Application of stable isotopes and mass isotopomer distribution analysis to the study of intermediary metabolism of nutrients.
Bequette BJ, Sunny NE, El-Kadi SW, Owens SL. Bequette BJ, et al. J Anim Sci. 2006 Apr;84 Suppl:E50-9. doi: 10.2527/2006.8413_supple50x. J Anim Sci. 2006. PMID: 16582092 Review. - Stable isotope-resolved metabolomics (SIRM) in cancer research with clinical application to nonsmall cell lung cancer.
Lane AN, Fan TW, Bousamra M 2nd, Higashi RM, Yan J, Miller DM. Lane AN, et al. OMICS. 2011 Mar;15(3):173-82. doi: 10.1089/omi.2010.0088. Epub 2011 Feb 17. OMICS. 2011. PMID: 21329461 Free PMC article. Review.
Cited by
- Stable Isotope Resolved Metabolomics Analysis of Ribonucleotide and RNA Metabolism in Human Lung Cancer Cells.
Fan TW, Tan J, McKinney MM, Lane AN. Fan TW, et al. Metabolomics. 2012 Jun;8(3):517-527. doi: 10.1007/s11306-011-0337-9. Metabolomics. 2012. PMID: 26146495 Free PMC article. - (13)C glucose labelling studies using 2D NMR are a useful tool for determining ex vivo whole organ metabolism during hypothermic machine perfusion of kidneys.
Nath J, Smith T, Hollis A, Ebbs S, Canbilen SW, Tennant DA, Ready AR, Ludwig C. Nath J, et al. Transplant Res. 2016 Aug 5;5:7. doi: 10.1186/s13737-016-0037-0. eCollection 2016. Transplant Res. 2016. PMID: 27499851 Free PMC article. - Advances in NMR-based biofluid analysis and metabolite profiling.
Zhang S, Nagana Gowda GA, Ye T, Raftery D. Zhang S, et al. Analyst. 2010 Jul;135(7):1490-8. doi: 10.1039/c000091d. Epub 2010 Apr 9. Analyst. 2010. PMID: 20379603 Free PMC article. Review. - Can nuclear magnetic resonance (NMR) spectroscopy reveal different metabolic signatures for lung tumours?
Duarte IF, Rocha CM, Barros AS, Gil AM, Goodfellow BJ, Carreira IM, Bernardo J, Gomes A, Sousa V, Carvalho L. Duarte IF, et al. Virchows Arch. 2010 Dec;457(6):715-25. doi: 10.1007/s00428-010-0993-6. Epub 2010 Oct 13. Virchows Arch. 2010. PMID: 20941505 - Correcting for the effects of natural abundance in stable isotope resolved metabolomics experiments involving ultra-high resolution mass spectrometry.
Moseley HN. Moseley HN. BMC Bioinformatics. 2010 Mar 17;11:139. doi: 10.1186/1471-2105-11-139. BMC Bioinformatics. 2010. PMID: 20236542 Free PMC article.
References
- Warburg O. On the origin of cancer cells. Science. 1956;123:309–314. - PubMed
- Atsumi T, Chesney J, Metz C, Leng L, Donnelly S, Makita Z, Mitchell R, Bucala R. High expression of inducible 6-phosphofructo-2-kinase/fructose-2,6-bisphosphatase (iPFK-2; PFKFB3) in human cancers. Cancer Research. 2002;62:5881–5887. - PubMed
- Katabi MM, Chan HLB, Karp SE, Batist G. Hexokinase type II: A novel tumor-specific promoter for gene-targeted therapy differentially expressed and regulated in human cancer cells. Human Gene Therapy. 1999;10:155–164. - PubMed
- Koukourakis MI, Giatromanolaki A, Sivridis E. Lactate dehydrogenase isoenzymes 1 and 5: Differential expression by neoplastic and stromal cells in non-small cell lung cancer and other epithelial malignant tumors. Tumor Biology. 2003;24:199–202. - PubMed
Publication types
MeSH terms
Substances
Grants and funding
- 1R01CA118434-01A2/CA/NCI NIH HHS/United States
- 1R01CA101199-01/CA/NCI NIH HHS/United States
- P20 RR018733/RR/NCRR NIH HHS/United States
- RR018733/RR/NCRR NIH HHS/United States
- R01 CA118434/CA/NCI NIH HHS/United States
- R01 CA101199/CA/NCI NIH HHS/United States
LinkOut - more resources
Full Text Sources
Other Literature Sources
Medical
Miscellaneous
