Allelic polymorphism within the TAS1R3 promoter is associated with human taste sensitivity to sucrose - PubMed (original) (raw)
Allelic polymorphism within the TAS1R3 promoter is associated with human taste sensitivity to sucrose
Alexey A Fushan et al. Curr Biol. 2009.
Abstract
Human sweet taste perception is mediated by the heterodimeric G protein-coupled receptor encoded by the TAS1R2 and TAS1R3 genes. Variation in these genes has been characterized, but the functional consequences of such variation for sweet perception are unknown. We found that two C/T single-nucleotide polymorphisms (SNPs) located at positions -1572 (rs307355) and -1266 (rs35744813) upstream of the TAS1R3 coding sequence strongly correlate with human taste sensitivity to sucrose and explain 16% of population variability in perception. By using a luciferase reporter assay, we demonstrated that the T allele of each SNP results in reduced promoter activity in comparison to the C alleles, consistent with the phenotype observed in humans carrying T alleles. We also found that the distal region of the TAS1R3 promoter harbors a composite cis-acting element that has a strong silencing effect on promoter activity. We conclude that the rs307355 and rs35744813 SNPs affect gene transcription by altering the function of this regulatory element. A worldwide population survey reveals that the T alleles of rs307355 and rs35744813 occur at lowest frequencies in European populations. We propose that inherited differences in TAS1R3 transcription account for a substantial fraction of worldwide differences in human sweet taste perception.
Figures
Figure 1
Sucrose sensitivity scores distributed normally in the population of 144 unrelated test subjects. (A) Frequency histogram showing the distribution of AUC scores. K.-S. d, Kolmogorov-Smirnov test for normality of empirical distribution. Lilliefors p, Lilliefors test for significance of K.-S. difference statistic. (B) Quantile-quantile plot of the empirical variable against the standardized normal variable. The vertical scale denotes the individual AUC values sorted in order from smallest to largest. The bottom axis shows a normally distributed variable. The top axis denotes probability of observations of a normally distributed variable. The regression line (green) is a reference demonstrating theoretically perfect fit between the empirical and theoretical distributions. Red dashed lines indicate 99% confidence intervals.
Figure 2
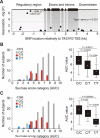
Rs307355 (−1572) and rs35744813 (−1266) T alleles are significantly associated with decreased sucrose sensitivity scores. (A) The results of ANOVA association analysis of TAS1R3 SNP polymorphisms (MAF > 0.05) with phenotypes. Vertical scale is a probability of association, −log10 transformed. Horizontal axis indicates SNP positions in kb relatively to TAS1R3 translation start site, with bp 0 indicating the A of the ATG initiation codon. Dashed line on the graph indicates Type I error threshold, Bonferroni adjusted. (B and C) Frequency histograms and Box-Whisker plots demonstrate the distributions of individual AUC scores among rs307355 and rs35744813 genotypic groups. Black bars on Box-Whisker plots correspond to 25% and 75% percentiles, vertical lines indicate AUC value ranges. White rectangles inside of black bars are within group means. P, statistical significance of among group mean differences (Bonferroni post-hoc test).
Figure 3
The results of ex vivo reporter analyses of TAS1R3 promoter variants in NCI-H716 cell line. (A) Reporter expression analyses of 5’-truncated promoter variants (table on the right and Table S5). Each black bar corresponds to individual assay and represents mean value of firefly luciferase activity normalized against the Renilla luciferase activity. Error bars show value ranges. RLU, relative light units. N, promoter-less negative control. (B) Reporter expression analysis of the intact promoter compared to the promoter variant with inverted sequence region located between nt −1700 and −1400. Black arrows below of the graph indicate normal orientation (arrow oriented up) and reverse orientation (arrow oriented down) of −1700 bp to −1400 bp sequence region. (C) Reporter expression analyses of promoter variants differing by genotypes at nt positions −1266 bp and −1572 bp. Table below of the graph shows specific genotypes at each of the two nucleotide positions. Symbols × in the table indicate eliminated E-box TFBS sequences. Asterisks, significance level of among group mean differences (unpaired t-test): one asterisk, P < 0.05; two asterisks, P < 0.01.
Figure 4
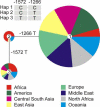
Median joining network of three haplotypes found in 1064 individuals from the HGDP-CEPH diversity panel, color coded according to regions of origin.
Similar articles
- Perceptual variation in umami taste and polymorphisms in TAS1R taste receptor genes.
Chen QY, Alarcon S, Tharp A, Ahmed OM, Estrella NL, Greene TA, Rucker J, Breslin PA. Chen QY, et al. Am J Clin Nutr. 2009 Sep;90(3):770S-779S. doi: 10.3945/ajcn.2009.27462N. Epub 2009 Jul 8. Am J Clin Nutr. 2009. PMID: 19587085 Free PMC article. - Salivary leptin and TAS1R2/TAS1R3 polymorphisms are related to sweet taste sensitivity and carbohydrate intake from a buffet meal in healthy young adults.
Han P, Keast RSJ, Roura E. Han P, et al. Br J Nutr. 2017 Nov;118(10):763-770. doi: 10.1017/S0007114517002872. Epub 2017 Nov 7. Br J Nutr. 2017. PMID: 29110749 - Association of sweet taste receptor gene polymorphisms with dental caries experience in school children.
Haznedaroğlu E, Koldemir-Gündüz M, Bakır-Coşkun N, Bozkuş HM, Çağatay P, Süsleyici-Duman B, Menteş A. Haznedaroğlu E, et al. Caries Res. 2015;49(3):275-81. doi: 10.1159/000381426. Epub 2015 Apr 24. Caries Res. 2015. PMID: 25924601 - Taste perception: how sweet it is (to be transcribed by you).
Mainland JD, Matsunami H. Mainland JD, et al. Curr Biol. 2009 Aug 11;19(15):R655-6. doi: 10.1016/j.cub.2009.06.050. Curr Biol. 2009. PMID: 19674550 Free PMC article. Review. - Variation in umami perception and in candidate genes for the umami receptor in mice and humans.
Shigemura N, Shirosaki S, Ohkuri T, Sanematsu K, Islam AA, Ogiwara Y, Kawai M, Yoshida R, Ninomiya Y. Shigemura N, et al. Am J Clin Nutr. 2009 Sep;90(3):764S-769S. doi: 10.3945/ajcn.2009.27462M. Epub 2009 Jul 22. Am J Clin Nutr. 2009. PMID: 19625681 Free PMC article. Review.
Cited by
- Minireview: Nutrient sensing by G protein-coupled receptors.
Wauson EM, Lorente-Rodríguez A, Cobb MH. Wauson EM, et al. Mol Endocrinol. 2013 Aug;27(8):1188-97. doi: 10.1210/me.2013-1100. Epub 2013 Jul 2. Mol Endocrinol. 2013. PMID: 23820899 Free PMC article. Review. - The development of sweet taste: From biology to hedonics.
Mennella JA, Bobowski NK, Reed DR. Mennella JA, et al. Rev Endocr Metab Disord. 2016 Jun;17(2):171-8. doi: 10.1007/s11154-016-9360-5. Rev Endocr Metab Disord. 2016. PMID: 27193110 Free PMC article. Review. - Is the Association Between Sweet and Bitter Perception due to Genetic Variation?
Hwang LD, Breslin PAS, Reed DR, Zhu G, Martin NG, Wright MJ. Hwang LD, et al. Chem Senses. 2016 Nov 1;41(9):737-744. doi: 10.1093/chemse/bjw083. Chem Senses. 2016. PMID: 27506221 Free PMC article. - A Comparison of Collection Techniques for Gene Expression Analysis of Human Oral Taste Tissue.
Archer NS, Liu D, Shaw J, Hannan G, Duesing K, Keast R. Archer NS, et al. PLoS One. 2016 Mar 24;11(3):e0152157. doi: 10.1371/journal.pone.0152157. eCollection 2016. PLoS One. 2016. PMID: 27010324 Free PMC article. - Understanding the metabolic and health effects of low-calorie sweeteners: methodological considerations and implications for future research.
Sylvetsky AC, Blau JE, Rother KI. Sylvetsky AC, et al. Rev Endocr Metab Disord. 2016 Jun;17(2):187-94. doi: 10.1007/s11154-016-9344-5. Rev Endocr Metab Disord. 2016. PMID: 26936185 Free PMC article. Review.
References
- Sainz E, Cavenagh MM, LopezJimenez ND, Gutierrez JC, Battey JF, Northup JK, Sullivan SL. The G-protein coupling properties of the human sweet and amino acid taste receptors. Developmental neurobiology. 2007;67:948–959. - PubMed
- Zhao GQ, Zhang Y, Hoon MA, Chandrashekar J, Erlenbach I, Ryba NJ, Zuker CS. The receptors for mammalian sweet and umami taste. Cell. 2003;115:255–266. - PubMed
- Max M, Shanker YG, Huang L, Rong M, Liu Z, Campagne F, Weinstein H, Damak S, Margolskee RF. Tas1r3, encoding a new candidate taste receptor, is allelic to the sweet responsiveness locus Sac. Nature genetics. 2001;28:58–63. - PubMed
Publication types
MeSH terms
Substances
LinkOut - more resources
Full Text Sources
Other Literature Sources
Medical


