Output properties and organization of the forelimb representation of motor areas on the lateral aspect of the hemisphere in rhesus macaques - PubMed (original) (raw)
Output properties and organization of the forelimb representation of motor areas on the lateral aspect of the hemisphere in rhesus macaques
Marie-Hélène Boudrias et al. Cereb Cortex. 2010 Jan.
Abstract
Motor output capabilities of the forelimb representation of dorsal motor area (PMd) and ventral motor area (PMv) were compared with primary motor cortex (M1) in terms of latency, strength, sign, and distribution of effects. Stimulus-triggered averages (60 microA) of electromyographic activity collected from 24 forelimb muscles were computed at 314 tracks in 2 monkeys trained to perform a reach-to-grasp task. The onset latency and magnitude of facilitation effects from PMd and PMv were significantly longer and 7- to 9-fold weaker than those from M1. Proximal muscles were predominantly represented in PMd and PMv. A joint-dependent flexor or extensor preference was also present. Distal and proximal muscle representations were intermingled in PMd and PMv. A gradual increase in latency and decrease in magnitude of effects were observed in moving from M1 surface sites toward more anterior sites in PMd. For many muscles, segregated areas producing suppression effects were found along the medial portion of PMd and adjacent M1. Although some facilitation effects from PMd and PMv had onset latencies as short as those from M1 in the same muscle, suggesting equal direct linkage, the vast majority had properties consistent with a more indirect linkage to motoneurons either through corticocortical connections with M1 and/or interneuronal linkages in the spinal cord.
Figures
Figure 1.
Dorsal view of the electrode penetration maps of the left hemisphere in 2 monkeys. Red area corresponds to tracks in M1 where StTA yielded PStEs, blue area corresponds to tracks where StTA yielded PStEs in PMd, green area corresponds to tracks where StTA yielded PStEs in PMv, gray area indicates boundary zone between M1 and lateral premotor areas, tracks where StTA at 60 μA produced PStEs are marked by small black dots, tracks where StTA did not produce PStEs at 60 μA are marked by small gray dots, tracks where ICMS produced hindlimb movements in M1 and PMd are highlighted in orange, and tracks where ICMS produced oral–facial movements in M1 and PMv are enclosed by fine dotted lines. Course dotted lines indicate the fundus (curvature) of the central sulcus and other sulci. The arrow indicates the lateral limit of PStEs from M1 included in the data set for the transition of magnitude and latency from M1 to PMd sites in Figures 2–4. The midline is located 8–9 mm medial to the superior precentral sulcus for both monkeys. Tracks were performed 1 mm apart. A, Anterior; ArS, arcuate sulcus; CS, central sulcus; M, medial; and SPS, superior precentral sulcus.
Figure 2.
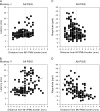
Increasing latencies of PStF effects in moving from the convexity of the central sulcus to the most anterior part of PMd. Negative values on the axis correspond to sites located on the surface of the M1 forelimb representation, dotted lines at zero correspond to the boundary between PMd and M1 as represented in Figure 1, and positive values correspond to sites in PMd. Latency is plotted separately for distal joints (A, B), proximal joints (C, D), and all joints (E, F) in 2 monkeys (J and Y). Linear regression: (A) _r_2 = 0.09, P < 0.001; (B) _r_2 = 0.06, P < 0.001; (C) _r_2 = 0.09, P < 0.001; (D) _r_2 = 0.18, P < 0.001; (E) _r_2 = 0.05, P < 0.001;and (F) _r_2 = 0.15, P < 0.001. M1 data included all PStEs obtained at 60 μA from layer V sites on the surface of the cortex. For monkey J, N = 520 (N = 311 for proximal joints and N = 209 for distal joints). For monkey Y, N = 724 (N = 391 for proximal joints and N = 333 for distal joints).
Figure 3.
Decreasing magnitude of PStF effects in moving from the convexity of the central sulcus in M1 to the most anterior part of PMd. Magnitude plotted separately for proximal joints, distal joints, and all joints in 2 monkeys. For better resolution, (G, H) are same data as (E, F) but restricting the M1 data to sites within 2.12 mm of the PMd border and expanding the vertical axis. Dotted lines at zero correspond to the boundary between PMd and M1 as represented in Figure 1; positive values correspond to sites in PMd. Nonlinear regression, exponential decay: (A) _r_2 = 0.18, P < 0.0001; (B) _r_2 = 0.28, P < 0.0001; (C) _r_2 = 0.12, P < 0.0001; (D) _r_2 = 0.20, P < 0.0001; (E) _r_2 = 0.13, P < 0.0001; (F) _r_2 = 0.21, P < 0.0001; (G) _r_2 = 0.11, P < 0.0001; and (H) _r_2 = 0.21, P < 0.001. Magnitude is expressed as ppi over baseline. Numbers of effects in A_–_D are the same as in Figure 2. (G) N = 263. (H) N = 395.
Figure 4.
Increasing latency (A, B) and decreasing magnitude (C, D) of PStS effects moving rostrally from M1 sites at the convexity of the central sulcus to the most proximal PMd sites in 2 monkeys. Dotted lines at zero correspond to the boundary between PMd and M1 as represented in Figure 1; positive values correspond to sites in PMd. Best-fit regression line was linear for all plots. (A) _r_2 = 0.06, P < 0.001; (B) _r_2 = 0.11, P < 0.001; (C) _r_2 = 0.07, P < 0.001; (D) _r_2 = 0.28, P < 0.001. Magnitude is expressed as ppd below baseline. N = 208 for monkey J and N = 117 for monkey Y.
Figure 5.
Distribution of onset latencies and magnitudes of PStF effects obtained at 60 μA from the forelimb representations of PMd, PMv, and M1. M1 data are based on PStF effects that were present at both 15 and 60 μA. Magnitudes are expressed as ppi over baseline. Note the difference in magnitude scales for M1 versus the graphs for PMd and PMv; the dotted line in the graph of M1 magnitude corresponds to the highest magnitude effect in the PMd and PMv histograms. N = 327 for PMd, N = 357 for PMv, and N = 340 for M1.
Figure 6.
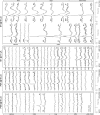
StTA of forelimb muscles from 1 site in PMd and 1 site in PMv at a stimulus intensity of 60 μA, and 1 M1 site at 2 different intensities, 15 and 60 μA. Time zero corresponds to the stimulus trigger event used for compiling the average. PStF effects were observed in muscles shown in bold, and records with no PStEs are unbolded. The range of number of trigger events for different channels is given in parenthesis. The number above each record is the magnitude of the PStE expressed as ppi over baseline.
Figure 7.
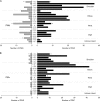
Distribution of PStF (right) and PStS (left) in 23 muscles of the forelimb from stimuli applied to PMd (A) and PMv (B). The dotted lines separate muscles belonging to different joints. The asterisks on PEC, FCU, and ED 4, 5 indicate PStEs from monkey J only. For technical reasons (see Materials and Methods), in monkey Y, a combination of TLON and TLAT was used to form a triceps (TRI) EMG and a combination of FDI and APB was used to form an Intrins. EMG. To compensate for this, the total number of PStEs in the TRI and Intrins. records was divided by 2 and distributed equally in muscles labeled TLON and TLAT and in muscles FDI and APB, respectively. See Materials and Methods for muscle abbreviations.
Figure 8.
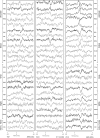
StTA (60 μA) of forelimb muscles from 3 PMd sites located 1–3 mm anterior to the boundary between M1 and PMd. Time zero corresponds to the stimulus event used for compiling the average. PStS effects were observed in muscles shown in bold, PStF effects are also in bold but marked with an asterisk, and no PStEs were observed in the unbolded records. The range in number of trigger events for different channels is given in parenthesis (lower right).
Figure 9.
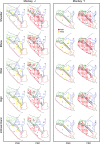
Muscle output maps for PMd, PMv, and M1 obtained at 60 μA from 2 monkeys based on PStEs at 60 μA in shoulder, elbow, wrist, digit, and intrinsic hand muscles. PStF (red dots) and PStS (yellow dots) are shown in separate columns. The outlined regions in the background are the boundaries of PMd, PMv, and M1 carried over from Figure 1.
Figure 10.
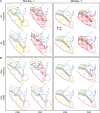
Muscle output maps showing the representation of proximal and distal muscles for PMd, PMv, and M1 in 2 monkeys based on PStEs at 60 μA. (A) Sites where PStEs were obtained in both proximal and distal joints. PStF (red dots) and PStS (yellow dots) are shown in separate columns. (B) Sites where only proximal or only distal PStEs were present. The outlined regions in the background are the boundaries of PMd, PMv, and M1 carried over from Figure 1.
Figure 11.
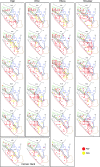
Individual muscle representations for monkey J based on PStF and PStS effects obtained at 60 μA from PMd, PMv, and M1. Red dots indicate sites where PStF was elicited and yellow dots indicate sites where PStS was elicited. The outlined regions in the background are the boundaries of PMd, PMv, and M1 carried over from Figure 1.
Figure 12.
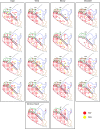
Individual muscle representations for monkey Y based on PStF and PStS effects obtained at 60 μA from PMd, PMv, and M1. Red dots indicate sites where PStF was elicited and yellow dots indicate sites where PStS was elicited. The outlined regions in the background are the boundaries of PMd, PMv, and M1 carried over from Figure 1.
Figure 13.
Distribution of PStF (A_–_C) and PStS (B_–_D) from PMd and PMv in extensor (gray bars) and flexor muscles (black bars) of the shoulder, elbow, wrist, and digit muscles after normalizing for differences in the number of recorded flexor and extensor muscles present at each joint and for the total number of muscles recorded across all joints. Flexor–extensor differences at each joint were normalized to the muscle group (flexor or extensor) with the greater number of recorded muscles. The data were further normalized to 6 recorded muscles at each joint, which was the actual number recorded at the elbow joint. Intrinsic muscles FDI and APB are plotted as flexor and extensor, respectively. Significant differences (chi-square test, P < 0.05) are indicated with asterisks.
Similar articles
- Forelimb muscle representations and output properties of motor areas in the mesial wall of rhesus macaques.
Boudrias MH, Lee SP, Svojanovsky S, Cheney PD. Boudrias MH, et al. Cereb Cortex. 2010 Mar;20(3):704-19. doi: 10.1093/cercor/bhp136. Epub 2009 Jul 24. Cereb Cortex. 2010. PMID: 19633176 Free PMC article. - Contrasting properties of motor output from the supplementary motor area and primary motor cortex in rhesus macaques.
Boudrias MH, Belhaj-Saïf A, Park MC, Cheney PD. Boudrias MH, et al. Cereb Cortex. 2006 May;16(5):632-8. doi: 10.1093/cercor/bhj009. Epub 2005 Jul 27. Cereb Cortex. 2006. PMID: 16049188 - Properties of primary motor cortex output to forelimb muscles in rhesus macaques.
Park MC, Belhaj-Saïf A, Cheney PD. Park MC, et al. J Neurophysiol. 2004 Nov;92(5):2968-84. doi: 10.1152/jn.00649.2003. Epub 2004 May 26. J Neurophysiol. 2004. PMID: 15163675 - Consistent features in the forelimb representation of primary motor cortex in rhesus macaques.
Park MC, Belhaj-Saïf A, Gordon M, Cheney PD. Park MC, et al. J Neurosci. 2001 Apr 15;21(8):2784-92. doi: 10.1523/JNEUROSCI.21-08-02784.2001. J Neurosci. 2001. PMID: 11306630 Free PMC article. - Motor areas in the frontal lobe of the primate.
Dum RP, Strick PL. Dum RP, et al. Physiol Behav. 2002 Dec;77(4-5):677-82. doi: 10.1016/s0031-9384(02)00929-0. Physiol Behav. 2002. PMID: 12527018 Review.
Cited by
- Differential Modulation of Local Field Potentials in the Primary and Premotor Cortices during Ipsilateral and Contralateral Reach to Grasp in Macaque Monkeys.
Falaki A, Quessy S, Dancause N. Falaki A, et al. J Neurosci. 2024 May 22;44(21):e1161232024. doi: 10.1523/JNEUROSCI.1161-23.2024. J Neurosci. 2024. PMID: 38589229 Free PMC article. - Motor actions are spatially organized in motor and dorsal premotor cortex.
Chehade NG, Gharbawie OA. Chehade NG, et al. Elife. 2023 Oct 19;12:e83196. doi: 10.7554/eLife.83196. Elife. 2023. PMID: 37855376 Free PMC article. - Microstimulation of the Premotor Cortex of the Cat Produces Phase-Dependent Changes in Locomotor Activity.
Fortier-Lebel N, Nakajima T, Yahiaoui N, Drew T. Fortier-Lebel N, et al. Cereb Cortex. 2021 Oct 22;31(12):5411-5434. doi: 10.1093/cercor/bhab167. Cereb Cortex. 2021. PMID: 34289039 Free PMC article. - Shoulder position and handedness differentially affect excitability and intracortical inhibition of hand muscles.
Geed S, Grainger M, Harris-Love ML, Lum PS, Dromerick AW. Geed S, et al. Exp Brain Res. 2021 May;239(5):1517-1530. doi: 10.1007/s00221-021-06077-w. Epub 2021 Mar 9. Exp Brain Res. 2021. PMID: 33751158 Free PMC article. - Interhemispheric modulations of motor outputs by the rostral and caudal forelimb areas in rats.
Touvykine B, Elgbeili G, Quessy S, Dancause N. Touvykine B, et al. J Neurophysiol. 2020 Apr 1;123(4):1355-1368. doi: 10.1152/jn.00591.2019. Epub 2020 Mar 4. J Neurophysiol. 2020. PMID: 32130080 Free PMC article.
References
- Asanuma H, Rosen I. Functional role of afferent inputs to the monkey motor cortex. Brain Res. 1972;40:3–5. - PubMed
- Boudrias MH, Belhaj-Saif A, Park MC, Cheney PD. Contrasting properties of motor output from the supplementary motor area and primary motor cortex in rhesus macaques. Cereb Cortex. 2006;16:632–638. - PubMed
- Brodmann K. Vergleichende Lokalisationslehre der Grosshirnrinde in ihren Prinzipien dargestellt auf Grund des Zellenbaues. 1909. Leipzig (Germany): Johann A. Barth Verlag.
- Cerri G, Shimazu H, Maier MA, Lemon RN. Facilitation from ventral premotor cortex of primary motor cortex outputs to macaque hand muscles. J Neurophysiol. 2003;90:832–842. - PubMed


