Knockdown of ASIC1 and epithelial sodium channel subunits inhibits glioblastoma whole cell current and cell migration - PubMed (original) (raw)
Knockdown of ASIC1 and epithelial sodium channel subunits inhibits glioblastoma whole cell current and cell migration
Niren Kapoor et al. J Biol Chem. 2009.
Abstract
High grade gliomas such as glioblastoma multiforme express multiple members of the epithelial sodium channel (ENaC)/Degenerin family, characteristically displaying a basally active amiloride-sensitive cation current not seen in normal human astrocytes or lower grade gliomas. Using quantitative real time PCR, we have shown higher expression of ASIC1, alphaENaC, and gammaENaC in D54-MG human glioblastoma multiforme cells compared with primary human astrocytes. We hypothesize that this glioma current is mediated by a hybrid channel composed of a mixture of ENaC and acid-sensing ion channel (ASIC) subunits. To test this hypothesis we made dominant negative cDNAs for ASIC1, alphaENaC, gammaENaC, and deltaENaC. D54-MG cells transfected with the dominant negative constructs for ASIC1, alphaENaC, or gammaENaC showed reduced protein expression and a significant reduction in the amiloride-sensitive whole cell current as compared with untransfected D54-MG cells. Knocking down alphaENaC or gammaENaC also abolished the high P(K)(+)/P(Na)(+) of D54-MG cells. Knocking down deltaENaC in D54-MG cells reduced deltaENaC protein expression but had no effect on either the whole cell current or K(+) permeability. Using co-immunoprecipitation we show interactions between ASIC1, alphaENaC, and gammaENaC, consistent with these subunits interacting with each other to form an ion channel in glioma cells. We also found a significant inhibition of D54-MG cell migration after ASIC1, alphaENaC, or gammaENaC knockdown, consistent with the hypothesis that ENaC/Degenerin subunits play an important role in glioma cell biology.
Figures
FIGURE 1.
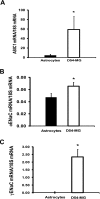
Relative mRNA levels from D54-MG glioblastoma cells and primary human astrocytes. This figure shows average relative mRNA expression for different ENaC/Deg subunits proportional to 18 S in D54-MG glioblastoma cells and primary human astrocytes. A significantly higher expression for ASIC1 (A), αENaC (B), and γENaC (C) is seen in D54-MG cells compared with astrocytes. The results are the averages of six different samples of D54-MG, and astrocytes ran in duplicate with similar results. Error bars ± 1 S.D. The asterisk indicates p < 0.05.
FIGURE 2.
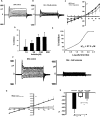
Whole cell patch clamp recording of D54-MG cells. Representative traces of whole cell patch clamp recording of D54-MG glioma cells showing basally active whole cell current (A), which is inhibited after perfusion of 100 μ
m
amiloride to the bath solution (B). C, average I/V curve from whole cell patch clamp recording on D54-MG cells before and after the addition of 100 μ
m
amiloride. Traces are an average from 5 cells. D, average conductance decrease at each drug concentration based on measurements from 5 cells for each concentration except 300 μ
m,
where n = 4 cells. E, average conductance converted to a percentage of the maximum average reduction recorded in cells exposed to 300 μ
m
amiloride. F, to look for the effect of higher concentrations of amiloride on D54-MG current, cells were patched-clamped before (left trace) and after application of 1 m
m
amiloride (right trace). Representative traces showing complete inhibition of whole cell current after application of 1 m
m
amiloride to the bath solution. G, the corresponding I/V curve and average conductance at −100 mV (H) showing a significant inhibition of inward current after addition of 1 m
m
amiloride; n = 3. Error bars ± 1 S.D. The asterisk indicates p < 0.05.
FIGURE 3.
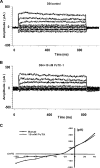
Psalmotoxin 1 completely abolishes D54-MG whole cell current. Whole cell currents recorded from a D54-MG glioblastoma cell with normal intracellular and extracellular ionic concentrations for Na+, K+, Cl−, Ca2+, and pH. The voltage clamp potentials ranged from −160 to +40 mV. The large negative potentials were used to maximize the inward currents. A shows the basal conductance of the cell. B shows that after exposure to 10 n
m
PcTx-1, the inward currents were abolished, indicating a complete inhibition of the inward sodium conductance. C, corresponding I/V curve; n = 3.
FIGURE 4.
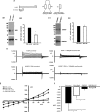
Knockdown of ASIC1 cDNA and whole cell patch clamp recording. A, diagram depicting the schematic of the ASIC1 dominant negative constructs. Representative Western blot (B1) of lysates from D54-MG glioma cells transfected with DN eGFP-ASIC1 cDNA or untransfected control D54-MG cells probed for ASIC1 and quantified (B2) showing a 50–60% inhibition in ASIC1 protein expression in ASIC1 knockdown D54-MG cells compared with untransfected cells. C1, cell lysates from B were used to look for the specificity of dominant negative mutation techniques in knocking down the protein of interest. Lysates were probed by Western blot for γENaC protein expression. No difference was found in the γENaC protein expression between ASIC1 knockdown and control D54-MG cells (C2). Total actin (B1) and glyceraldehyde-3-phosphate dehydrogenase (GAPDH; C1) were used as the loading control; n = 3 for all the blots. D, representative whole-cell patch clamp records of control cells (upper panel) and those transfected with ASIC1 dominant negative cDNA for 48 h (lower panel). E, I/V curve showing significant inhibition of whole cell current after the addition of 100 μ
m
amiloride to the bath solution or after knocking down ASIC1 in D54-MG glioma cells. F, average conductance at −100 mV for each condition as in B showing significant inhibition of inward current after the addition of 100 μ
m
amiloride or after knocking down ASIC. Traces for D54 control n = 14, for D54 + 100 μ
m
amiloride n = 10, for ASIC1 DN and ASIC1 DN + 100 μ
m
amiloride n = 4. Error bars ±1 S.D. The asterisk indicates p < 0.05.
FIGURE 5.
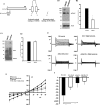
γENaC Knockdown and whole cell patch clamp recording in D54-MG glioma cells. A, diagram depicting the schematic of the γENaC dominant negative constructs. B1, immunoblot showing reduced expression of γENaC protein in DN-γENaC cDNA-transfected D54-MG cells compared with untransfected D54-MG control cells. B2, quantification of the blots showing a 60–70% reduction of γENaC protein in transfected cells compared with untransfected cells. To look for the specificity of γENaC knockdown, cell lysates from B were probed for expression of ASIC1 (C1 and C2) and αENaC (D1 and D2). Immunoblots showed similar expression of ASIC1 and αENaC in both DN-γENaC cDNA-transfected D54-MG cells and in control untransfected cells. Actin was used as loading control in all traces; n = 3 for all the blots. E, representative traces of untransfected D54-MG cells before and after infusion of 100 μ
m
amiloride (top panel) and after knocking down γENaC (lower panel). The corresponding I/V curve (F) and average conductance at −100 mV (G) showing a significant inhibition of inward current after the addition of 100 μ
m
amiloride or after knocking down γENaC. Control traces are the same as in Fig. 3; for γENaC knockdown, n = 6. Error bars ±1 S.D. The asterisk indicates p < 0.05.
FIGURE 6.
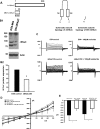
Knockdown of αENaC inhibits the basal whole cell current seen in D54-MG cells. A, diagram depicting the schematic of the αENaC dominant negative constructs. B1, immunoblot showing reduced expression of αENaC protein in DN-αENaC cDNA-transfected D54-MG cells compared with untransfected D54-MG control cells. B2, quantification of the blots show a 60% reduction of αENaC protein in transfected cells compared with untransfected cells. To look for the specificity of αENaC knockdown, cell lysates from B were probed for expression of ASIC1 (C1 and C2), and no difference was found in ASIC1 expression in D54-MG cells after αENaC knockdown compared with untransfected cells; n = 3 for all the blots. GAPDH, glyceraldehyde-3-phosphate dehydrogenase. D, representative traces of untransfected D54-MG cells before and after infusion of 100 μ
m
amiloride (top panel) and after knocking down αENaC (lower panel). E, the corresponding I/V curve and average conductance at −100 mV (F) showing a significant inhibition of inward current after the addition of 100 μ
m
amiloride or after knocking down αENaC. Control traces are the same as in Fig. 3; for αENaC knockdown, n = 5. Error bars are ±1 S.D. The asterisk indicates p < 0.05.
FIGURE 7.
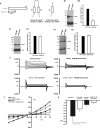
Knockdown of δENaC does not change the D54-MG glioma cell whole cell current. A, schematic diagram of δENaC dominant negative construct. B1, representative Western blot of DN δENaC and D54-MG cell lysate. B2, quantification of Western blots showing a 50% reduction of δENaC protein in cells transfected with dominant negative δENaC cDNA compared with untransfected D54-MG cells; n = 3. C shows representative traces of untransfected D54-MG cells before and after infusion of 100 μ
m
amiloride (top panel) and after knocking down δENaC (lower panel). D shows an I/V curve from whole-cell patch clamp recording of DN δENaC-transfected D54-MG cells showing no difference in whole cell current before or after knocking down δENaC. E, average conductance at −100 mV for each condition as in Fig. 6_B_, showing similar inward current for both D54-MG control cells and in D54-MG cells with δENaC knockdown. Amiloride significantly inhibited the inward current under both the conditions. Control traces are the same as in Fig. 3; for δENaC knockdown, traces n = 5. Error bars are ±1 S.D. The asterisk indicates p < 0.05.
FIGURE 8.
The higher K+ selectivity of glioma cells is abolished after knocking down γENaC and αENaC. A significant large increase in inward current was seen in D54-MG cells when Na+ was substituted with K+ as the major cation. This increase in inward current was abolished in D54-MG cells in which γENaC or αENaC were knocked down. Cells with δENaC knockdown showed a significant increase in inward current upon substituting K+ as the major cation similar to the effect seen in control cells. n = 4 for each condition except for γENaC DN, where n = 6. Error bars are ±1 S.D. The asterisk indicates p < 0.05.
FIGURE 9.
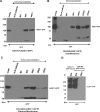
ENaC/Deg subunits interact with each other in glioma cells. A, lysate from CHO-K1 cells transfected with GFP ligated ASIC1 cDNA was immunoprecipitated (IP) with mouse anti-GFP or rabbit anti-ASIC1 antibody and blotted with mouse anti-GFP antibody. The Western blot shows that immunoprecipitating with either mouse anti-GFP or rabbit anti-ASIC1 antibody and blotting with mouse anti-GFP antibody pulled down GFP-ASIC1 at 100 kDa. Western blots of total membrane fractions (B) and plasma membrane fractions (C) isolated from D54-MG cells stably transfected with ASIC1-GFP and immunoprecipitated with mouse anti-GFP, rabbit anti-ASIC1, rabbit anti-αENaC, or rabbit anti-γENaC antibody show an interaction of ASIC1 with αENaC and γENaC in D54-MG cells. Non-immune mouse IgG immunoprecipitation and immunoprecipitation with only protein A-agarose beads showed that the anti-GFP antibody was specific. D, to rule out that ASIC1 and ENaC subunit interactions were because of a random association due to overexpression, CHO-K1 and D54-MG cells were transfected with an unrelated protein; CFP ligated CLC1. Lysates from both CHO-K1 and D54-MG cells immunoprecipitated (IP) with mouse anti-GFP antibody pulled down CFP-CLC1 upon blotting with mouse anti-GFP antibody, whereas immunoprecipitating D54-MG cell lysate with rabbit anti-ASIC1 antibody did not pull down CLC1 upon blotting with mouse anti-GFP antibody. n = 3 for all the blots.
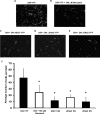
FIGURE 10.
Knocking down ASIC1, αENaC, or γENaC inhibits D54-MG glioma cell migration. Representative images are shown of migrated D54-MG cells transfected with eYFP (A), with 100 μ
m
benzamil in the migration buffer (B), with ASIC1 knockdown (C), αENaC knockdown (D), or with γENaC knockdown (E). The average number of cells that had migrated per field under each conditions (F) is shown. Error bars are ±1 S.D., and the asterisk indicates p < 0.05 comparing cell migration for D54-YFP with cell migration under other conditions. n = 3 for each experiment except D54-YFP, where n = 6.
Similar articles
- Interaction of ASIC1 and ENaC subunits in human glioma cells and rat astrocytes.
Kapoor N, Lee W, Clark E, Bartoszewski R, McNicholas CM, Latham CB, Bebok Z, Parpura V, Fuller CM, Palmer CA, Benos DJ. Kapoor N, et al. Am J Physiol Cell Physiol. 2011 Jun;300(6):C1246-59. doi: 10.1152/ajpcell.00199.2010. Epub 2011 Feb 23. Am J Physiol Cell Physiol. 2011. PMID: 21346156 Free PMC article. - Glioma-specific cation conductance regulates migration and cell cycle progression.
Rooj AK, McNicholas CM, Bartoszewski R, Bebok Z, Benos DJ, Fuller CM. Rooj AK, et al. J Biol Chem. 2012 Feb 3;287(6):4053-65. doi: 10.1074/jbc.M111.311688. Epub 2011 Nov 30. J Biol Chem. 2012. PMID: 22130665 Free PMC article. - Heteromeric assembly of acid-sensitive ion channel and epithelial sodium channel subunits.
Meltzer RH, Kapoor N, Qadri YJ, Anderson SJ, Fuller CM, Benos DJ. Meltzer RH, et al. J Biol Chem. 2007 Aug 31;282(35):25548-59. doi: 10.1074/jbc.M703825200. Epub 2007 Jul 5. J Biol Chem. 2007. PMID: 17613525 - ASIC and ENaC type sodium channels: conformational states and the structures of the ion selectivity filters.
Hanukoglu I. Hanukoglu I. FEBS J. 2017 Feb;284(4):525-545. doi: 10.1111/febs.13840. Epub 2016 Sep 15. FEBS J. 2017. PMID: 27580245 Review. - Insight toward epithelial Na+ channel mechanism revealed by the acid-sensing ion channel 1 structure.
Stockand JD, Staruschenko A, Pochynyuk O, Booth RE, Silverthorn DU. Stockand JD, et al. IUBMB Life. 2008 Sep;60(9):620-8. doi: 10.1002/iub.89. IUBMB Life. 2008. PMID: 18459164 Review.
Cited by
- ENaCs and ASICs as therapeutic targets.
Qadri YJ, Rooj AK, Fuller CM. Qadri YJ, et al. Am J Physiol Cell Physiol. 2012 Apr 1;302(7):C943-65. doi: 10.1152/ajpcell.00019.2012. Epub 2012 Jan 25. Am J Physiol Cell Physiol. 2012. PMID: 22277752 Free PMC article. Review. - Mambalgin-2 Induces Cell Cycle Arrest and Apoptosis in Glioma Cells via Interaction with ASIC1a.
Bychkov M, Shulepko M, Osmakov D, Andreev Y, Sudarikova A, Vasileva V, Pavlyukov MS, Latyshev YA, Potapov AA, Kirpichnikov M, Shenkarev ZO, Lyukmanova E. Bychkov M, et al. Cancers (Basel). 2020 Jul 8;12(7):1837. doi: 10.3390/cancers12071837. Cancers (Basel). 2020. PMID: 32650495 Free PMC article. - Interaction of ASIC1 and ENaC subunits in human glioma cells and rat astrocytes.
Kapoor N, Lee W, Clark E, Bartoszewski R, McNicholas CM, Latham CB, Bebok Z, Parpura V, Fuller CM, Palmer CA, Benos DJ. Kapoor N, et al. Am J Physiol Cell Physiol. 2011 Jun;300(6):C1246-59. doi: 10.1152/ajpcell.00199.2010. Epub 2011 Feb 23. Am J Physiol Cell Physiol. 2011. PMID: 21346156 Free PMC article. - NEDD4: a promising target for cancer therapy.
Ye X, Wang L, Shang B, Wang Z, Wei W. Ye X, et al. Curr Cancer Drug Targets. 2014;14(6):549-56. doi: 10.2174/1568009614666140725092430. Curr Cancer Drug Targets. 2014. PMID: 25088038 Free PMC article. Review. - Upregulation of α-ENaC induces pancreatic β-cell dysfunction, ER stress, and SIRT2 degradation.
Zhang X, Zhang D, Huo L, Zhou X, Zhang J, Li M, Su D, Sun P, Chen F, Liang X. Zhang X, et al. J Biomed Res. 2024 May 21;38(3):241-255. doi: 10.7555/JBR.37.20230128. J Biomed Res. 2024. PMID: 38769731 Free PMC article.
References
- Maher E. A., Furnari F. B., Bachoo R. M., Rowitch D. H., Louis D. N., Cavenee W. K., DePinho R. A. (2001) Genes Dev. 15, 1311–1333 - PubMed
- Berdiev B. K., Xia J., McLean L. A., Markert J. M., Gillespie G. Y., Mapstone T. B., Naren A. P., Jovov B., Bubien J. K., Ji H. L., Fuller C. M., Kirk K. L., Benos D. J. (2003) J. Biol. Chem. 278, 15023–15034 - PubMed
- Kellenberger S., Schild L. (2002) Physiol. Rev. 82, 735–767 - PubMed
Publication types
MeSH terms
Substances
Grants and funding
- CA101952/CA/NCI NIH HHS/United States
- R01 DK037206/DK/NIDDK NIH HHS/United States
- R56 DK037206/DK/NIDDK NIH HHS/United States
- R01 CA101952/CA/NCI NIH HHS/United States
- DK37206/DK/NIDDK NIH HHS/United States
LinkOut - more resources
Full Text Sources
