Distinct roles for key karyogamy proteins during yeast nuclear fusion - PubMed (original) (raw)
Distinct roles for key karyogamy proteins during yeast nuclear fusion
Patricia Melloy et al. Mol Biol Cell. 2009 Sep.
Abstract
During yeast mating, cell fusion is followed by the congression and fusion of the two nuclei. Proteins required for nuclear fusion are found at the surface (Prm3p) and within the lumen (Kar2p, Kar5p, and Kar8p) of the nuclear envelope (NE). Electron tomography (ET) of zygotes revealed that mutations in these proteins block nuclear fusion with different morphologies, suggesting that they act in different steps of fusion. Specifically, prm3 zygotes were blocked before formation of membrane bridges, whereas kar2, kar5, and kar8 zygotes frequently contained them. Membrane bridges were significantly larger and occurred more frequently in kar2 and kar8, than in kar5 mutant zygotes. The kinetics of NE fusion in prm3, kar5, and kar8 mutants, measured by live-cell fluorescence microscopy, were well correlated with the size and frequency of bridges observed by ET. However the kar2 mutant was defective for transfer of NE lumenal GFP, but not diffusion within the lumen, suggesting that transfer was blocked at the NE fusion junction. These observations suggest that Prm3p acts before initiation of outer NE fusion, Kar5p may help dilation of the initial fusion pore, and Kar2p and Kar8p act after outer NE fusion, during inner NE fusion.
Figures
Figure 1.
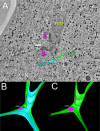
Wild-type nuclear fusion occurs in three steps. (A) A representative tomographic slice of a wild-type zygote fixed after completion of outer and inner nuclear membrane fusion. INE, inner NE; ONE, outer nuclear envelope; N, nucleus; S, SPB; nm, nuclear microtubules. (B) A model corresponding to the tomogram shown in A highlighting the outer (green) and inner membranes (light blue) of the NE. (C) Same model as in B except that only the outer membrane (green) is visible. Note that the central plaques of the spindle pole bodies (SPBs; pink) remain distinct after nuclear membrane fusion. Scale bar, 100 nm.
Figure 2.
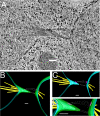
prm3Δ mutant zygotes fail to form membrane bridges. (A) Tomographic slice of a _prm3_Δ zygote showing no membrane fusion and electron-dense material between the SPBs. The nucleus (N) and electron-dense fibers are indicated. (B–D) Models of the tomogram shown in A. Outer membranes (green), inner membranes (blue), microtubules (yellow), spindle pole bodies (pink), and fibers (white) are modeled. Scale bars, 100 nm. Zygotes are produced from matings of MS7590 × MS7591.
Figure 3.
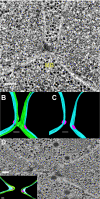
kar5-486 mutant zygotes infrequently form small membrane bridges. (A) Tomographic slice of a kar5-486 mutant zygote that has completed cell fusion, with its nuclei unfused and closely apposed. Note the presence of a membrane bridge near the SPBs. N, nucleus; MB, membrane bridge. (B) Model corresponding to the tomogram shown in A highlighting the outer NE with the membrane bridge (green), the unfused inner NE (light blue), and the spindle pole bodies (pink). (C) Same model as in B shown without the outer NE to indicate the separation of the inner NEs (light blue) and the two distinct SPBs (pink). (D) Tomographic slice of a kar5-486 mutant zygote that has completed cell fusion, but its nuclei are unfused, closely apposed, and do not have any membrane bridges. (D, inset) Model corresponding to tomographic slice shown in D. Scale bars, 100 nm.
Figure 4.
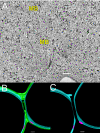
kar8-1333 mutant zygotes frequently form large membrane bridges. (A) Tomographic slice of a kar8-1333 mutant zygote in which two membrane bridges have formed between two closely apposed nuclei. N, nucleus; MB, membrane bridge. (B) Model corresponding to the tomogram shown in A, indicating the outer and inner NEs (green and light blue, respectively) and the two outer NE bridge connections. (C) Same model as in B except only the distinct inner NEs (light blue) and distinct SPBs (pink) are visible. Scale bars, 100 nm.
Figure 5.
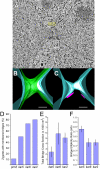
kar2-1 mutant zygotes frequently form membrane bridges. (A) Tomographic slice of a kar2-1 mutant zygote in which an outer NE bridge has formed. N, nucleus; MB, membrane bridge. (B) Model corresponding to the tomogram shown in A depicting the outer NE with bridge (green) and the inner NE (light blue). (C) Same model as B except that only the two inner NEs (light blue) and two SPBs (pink) are visible. (D) Graph indicating the percent of zygotes with membrane bridges in the karyogamy mutant zygotes. (E) Graph showing the average total bridge cross-section for each type of mutant zygote. (F) Graph indicating average ellipticity ratio of the bridges in the mutant zygotes. The ellipticity is the ratio of the smallest diameter (major axis) to the largest diameter (major axis) for a cross-section across each bridge. Scale, 100 nm.
Figure 6.
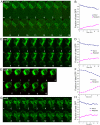
Transfer of a NE/ER luminal marker as a measure of outer NE fusion. (A) A time-lapse experiment (1-min time points) of two mating _prm3_Δ cells after cell fusion is complete. The SPBs have merged into a single dot (Spc42-RFP in red) by time point 2 indicating nuclear congression is complete. For A, C, E, and G, the NE/ER lumen is tagged with an ss-3X-GFP-HDEL NE/ER marker (green), with the donor nucleus shown at the top of the image and the potential recipient nucleus at the bottom. Note that in A, there is a slight increase in fluorescence in the recipient nucleus over time. (B**)** Graph of the fraction of total GFP fluorescence found in the recipient nucleus over time. The graph indicates donor GFP fluorescence in green and recipient GFP fluorescence in red. prm3 mutant zygotes were produced from MS7892 × MS7591 and MS7893 × MS7591 crosses. (C) Time-lapse analysis of kar5-486 mutant zygotes (1-min time points) after the NE/ER luminal marker. (D) Graph showing the fraction of total GFP in the donor and recipient cell during the time course in C. (E) Time-lapse analysis of a kar8-1333 mutant zygote (1-min time points) tracking the NE/ER luminal marker. (F) A graph showing fraction of total GFP in the donor and recipient during the time course showing a higher rate of transfer of GFP fluorescence into the recipient over time in these zygotes. (G) Time-lapse analysis of the transfer of a GFP-tagged ER luminal marker after cell fusion in a kar2-1 mutant zygote (1-min time points). (H) The graph to the right shows the fraction of total GFP in the donor and recipient during the time course.
Figure 7.
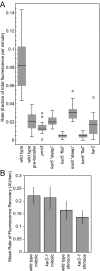
Analysis of NE/ER luminal marker transfer rates and FRAP analysis in wild-type and mutant NEs. (A) Graph of the fractional rate of the lumenal NE marker 3X-GFP-HDEL. The rate of transfer in wild-type cells is shown both after and before (pretransfer) NE fusion for comparison to the mutant zygotes. The kar5 and kar8 mutants contained two different populations of zygotes with distinctly different rates of transfer labeled “steep” and “flat.” For each mutant a box and whisker plot is shown. The box contains the inner quartiles, separated by the median. The whiskers depict the upper and lower quartiles. Outliers (more than 1.5 times the inner quartile range from the upper or lower quartiles) are depicted as circles. (B) FRAP analysis of wild-type and kar2-1 cells indicating rate of mobility of the NE/ER lumenal marker for wild-type mitotic, wild-type shmooing, kar2-1 mitotic, and kar2-1 shmooing cells as evidenced by the rate of fluorescence recovery. Shown are the average rates in arbitrary units/s. Error bars, SD. The number of cells of each type ranged from 11 to 23.
Figure 8.
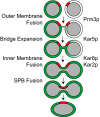
A pathway for nuclear fusion: The diagram depicts the pathway for nuclear fusion indicating possible steps for each protein. The nucleoplasm is shown in gray, the SPB is shown in red and contents of the nuclear lumen is shown is shown in green.
Similar articles
- Genetic interactions between KAR7/SEC71, KAR8/JEM1, KAR5, and KAR2 during nuclear fusion in Saccharomyces cerevisiae.
Brizzio V, Khalfan W, Huddler D, Beh CT, Andersen SS, Latterich M, Rose MD. Brizzio V, et al. Mol Biol Cell. 1999 Mar;10(3):609-26. doi: 10.1091/mbc.10.3.609. Mol Biol Cell. 1999. PMID: 10069807 Free PMC article. - Kar5p is required for multiple functions in both inner and outer nuclear envelope fusion in Saccharomyces cerevisiae.
Rogers JV, Rose MD. Rogers JV, et al. G3 (Bethesda). 2014 Dec 2;5(1):111-21. doi: 10.1534/g3.114.015800. G3 (Bethesda). 2014. PMID: 25467943 Free PMC article. - Prm3p is a pheromone-induced peripheral nuclear envelope protein required for yeast nuclear fusion.
Shen S, Tobery CE, Rose MD. Shen S, et al. Mol Biol Cell. 2009 May;20(9):2438-50. doi: 10.1091/mbc.e08-10-0987. Epub 2009 Mar 18. Mol Biol Cell. 2009. PMID: 19297527 Free PMC article. - KAR5 encodes a novel pheromone-inducible protein required for homotypic nuclear fusion.
Beh CT, Brizzio V, Rose MD. Beh CT, et al. J Cell Biol. 1997 Dec 1;139(5):1063-76. doi: 10.1083/jcb.139.5.1063. J Cell Biol. 1997. PMID: 9382856 Free PMC article. - Nuclear fusion in the yeast Saccharomyces cerevisiae.
Rose MD. Rose MD. Annu Rev Cell Dev Biol. 1996;12:663-95. doi: 10.1146/annurev.cellbio.12.1.663. Annu Rev Cell Dev Biol. 1996. PMID: 8970740 Review.
Cited by
- Cytosol-dependent membrane fusion in ER, nuclear envelope and nuclear pore assembly: biological implications.
Rafikova ER, Melikov K, Chernomordik LV. Rafikova ER, et al. Nucleus. 2010 Nov-Dec;1(6):487-91. doi: 10.4161/nucl.1.6.13514. Epub 2010 Sep 3. Nucleus. 2010. PMID: 21327091 Free PMC article. - Breaching the nuclear envelope in development and disease.
Hatch E, Hetzer M. Hatch E, et al. J Cell Biol. 2014 Apr 28;205(2):133-41. doi: 10.1083/jcb.201402003. Epub 2014 Apr 21. J Cell Biol. 2014. PMID: 24751535 Free PMC article. Review. - Genetic Evidence for Sexuality in Cochliopodium (Amoebozoa).
Wood FC, Heidari A, Tekle YI. Wood FC, et al. J Hered. 2017 Oct 30;108(7):769-779. doi: 10.1093/jhered/esx078. J Hered. 2017. PMID: 29036297 Free PMC article. - When yeast cells meet, karyogamy!: an example of nuclear migration slowly resolved.
Gibeaux R, Knop M. Gibeaux R, et al. Nucleus. 2013 May-Jun;4(3):182-8. doi: 10.4161/nucl.25021. Epub 2013 May 15. Nucleus. 2013. PMID: 23715006 Free PMC article. Review. - Dynamics of Male and Female Chromatin during Karyogamy in Rice Zygotes.
Ohnishi Y, Hoshino R, Okamoto T. Ohnishi Y, et al. Plant Physiol. 2014 Aug;165(4):1533-1543. doi: 10.1104/pp.114.236059. Epub 2014 Jun 19. Plant Physiol. 2014. PMID: 24948834 Free PMC article.
References
- Amberg D. C., Burke D. J., Strathern J. N. Methods in Yeast Genetics. Cold Spring Harbor, NY: Cold Spring Harbor Laboratory Press; 2005.
- Beilharz T., Egan B., Silver P. A., Hofmann K., Lithgow T. Bipartite signals mediate subcellular targeting of tail-anchored membrane proteins in Saccharomyces cerevisiae. J. Biol. Chem. 2003;278:8219–8223. - PubMed
Publication types
MeSH terms
Substances
Grants and funding
- R01 GM037739/GM/NIGMS NIH HHS/United States
- F32 GM069288/GM/NIGMS NIH HHS/United States
- R01 GM037739-22/GM/NIGMS NIH HHS/United States
- RR 00592/RR/NCRR NIH HHS/United States
- R01 GM37739/GM/NIGMS NIH HHS/United States
- T32 CA009528/CA/NCI NIH HHS/United States
- P41 RR000592/RR/NCRR NIH HHS/United States
LinkOut - more resources
Full Text Sources
Molecular Biology Databases
