Mitochondrial and Y-chromosome diversity of the Tharus (Nepal): a reservoir of genetic variation - PubMed (original) (raw)
Mitochondrial and Y-chromosome diversity of the Tharus (Nepal): a reservoir of genetic variation
Simona Fornarino et al. BMC Evol Biol. 2009.
Abstract
Background: Central Asia and the Indian subcontinent represent an area considered as a source and a reservoir for human genetic diversity, with many markers taking root here, most of which are the ancestral state of eastern and western haplogroups, while others are local. Between these two regions, Terai (Nepal) is a pivotal passageway allowing, in different times, multiple population interactions, although because of its highly malarial environment, it was scarcely inhabited until a few decades ago, when malaria was eradicated. One of the oldest and the largest indigenous people of Terai is represented by the malaria resistant Tharus, whose gene pool could still retain traces of ancient complex interactions. Until now, however, investigations on their genetic structure have been scarce mainly identifying East Asian signatures.
Results: High-resolution analyses of mitochondrial-DNA (including 34 complete sequences) and Y-chromosome (67 SNPs and 12 STRs) variations carried out in 173 Tharus (two groups from Central and one from Eastern Terai), and 104 Indians (Hindus from Terai and New Delhi and tribals from Andhra Pradesh) allowed the identification of three principal components: East Asian, West Eurasian and Indian, the last including both local and inter-regional sub-components, at least for the Y chromosome.
Conclusion: Although remarkable quantitative and qualitative differences appear among the various population groups and also between sexes within the same group, many mitochondrial-DNA and Y-chromosome lineages are shared or derived from ancient Indian haplogroups, thus revealing a deep shared ancestry between Tharus and Indians. Interestingly, the local Y-chromosome Indian component observed in the Andhra-Pradesh tribals is present in all Tharu groups, whereas the inter-regional component strongly prevails in the two Hindu samples and other Nepalese populations.The complete sequencing of mtDNAs from unresolved haplogroups also provided informative markers that greatly improved the mtDNA phylogeny and allowed the identification of ancient relationships between Tharus and Malaysia, the Andaman Islands and Japan as well as between India and North and East Africa. Overall, this study gives a paradigmatic example of the importance of genetic isolates in revealing variants not easily detectable in the general population.
Figures
Figure 1
Geographic map of Nepal. Sampled areas, in circles.
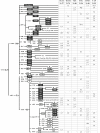
Figure 2
Phylogeny and frequencies (%) of mtDNA haplogroups in the populations studied. Haplogroups (East Asian in grey; West Eurasian in white; Indian in black) were assigned on the basis of both the control-region motifs and the coding-region polymorphisms [see Additional file 1] following published criteria (see Materials and Methods). Coding-region markers are reported as mutated nucleotide positions according to the rCRS [17] Mutations are transitions unless a base change is explicitly indicated. The 9-bp polymorphism: deletion = del; insertion = ins. Haplogroups with an asterix (*) include samples negative for the examined sub-groups.
Figure 3
Phylogeny and frequencies (%) of Y-chromosome haplogroups in the populations studied. Haplogroups: East Asian in grey; West Eurasian in white; Indian in black. The nomenclature and the hierarchical order of the mutations are according to the Y-Chromosome Consortium [62,67,73], updated with more recent markers: M429 [38]; M481 and P31 T-del (present study). The nomenclature of haplogroup H differs from that presented by Karafet et al. [73], in that all of our M82 samples were also M370 positive. H: intra-population haplogroup diversity, according to Nei [41]. In italics: markers not found. In parentheses: markers inferred. Haplogroups with an asterix* include samples negative for the examined sub-groups.
Figure 4
Phylogenetic tree of 51 mtDNA sequences. Mutations are scored relative to the rCRS [17]For the tree construction, the length variation in the poly-C stretch at np 16193 was not used, while the variation at np 309 is indicated only when phylogenetically relevant. Mutations are shown on the branches. They are transitions unless a base change is explicitly indicated; insertions are suffixed with a plus sign (+) and the inserted nucleotide(s), and deletions are characterized by "d"; back mutations are highlighted by "@"; recurrent mutations are underlined. Dating is reported in kilo years. Some sequences are incomplete: * from 3694 to 3738 nps; ** from 8353 to 8472 nps. For the ethnic/geographic origins of the samples, see Additional file 2. Population codes: Th-CI and Th-CII: Central Tharus; Th-E: Eastern Tharus; H-ND: Hindus from New Delhi; H-Te: Hindus from Terai; AP: Andhra Pradesh; UP: Uttar Pradesh; N-In, NE-In, S-In: North, North-East, South Indians, respectively; PK: Pakistan. Symbols surrounded by a circle are from literature. (a) Nomenclature different from that (M45) reported in the “mtDNA tree Build 5 (8 Jul 2009)” (
).
Figure 5
Phylogenetic tree of 30 mtDNA sequences. Mutations are scored relative to the rCRS [17]For the tree construction, the length variation in the poly-C stretch at np 16193 was not used, while the variation at np 309 is indicated only when phylogenetically relevant. Mutations are shown on the branches. They are transitions unless a base change is explicitly indicated; insertions are suffixed with a plus sign (+) and the inserted nucleotide(s), and deletions are characterized by “d”; back mutations are highlighted by “@”; recurrent mutations (considered in the global phylogeny of the 81 mtDNAs) are underlined. Dating is reported in kilo years. * Sequence incomplete from 411 to 628 and from 16189 to 16290 nps. For the ethnic/geographic origins of the samples, see Additional file 2. Population codes: Th-CI and Th-CII: Central Tharus; Th-E: Eastern Tharus; AP: Andhra Pradesh; UP: Uttar Pradesh; Pun: Punjab; NE-In: North-East Indians; E-In: East Indians; PK: Pakistan; Mal: Malaysia; And: Andaman Islands. Symbols surrounded by a circle are from literature. (a) Nomenclature different from that (M13b) reported in the “mtDNA tree Build 5 (8 Jul 2009)” (
).
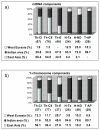
Figure 6
Histograms of the mtDNA (a) and Y-chromosome (b) components observed in the populations studied. Sample sizes are in parentheses.
Figure 7
Principal component analysis of mtDNA haplogroup frequencies. Comparison samples from Western Eurasia (Iran): Irn-W, Irn-E, Irn-C, Irn-SW, Irn-SE [12]; Indian subcontinent: AP, Andhra Pradesh [55]; WB-1, Castes from Bengal; WB-2, Kurmis from West Bengal; WB-3, Lodhas from West Bengal; Pj, Punjab; Rj, Rajput; Pa, Parsi; Gj, Gujarat; UP-2, Brahmins from Uttar Pradesh [12]; Th-UP, Tharus from Uttar Pradesh [12,56]; UP-1, Uttar Pradesh; Lb, Lobana group [56]; Pk, Karachis [42]; East Asia: Han-SE, Guandong [58]; Uzb, Uzbek; Uyg, Uygur; Kaz, Kazak; Mong, Mongolia; Hui, Xinjiang [59,60]; and Indonesia: Su, Sumatra; Bo, Borneo; Jv, Java; Ba, Bali; Lk, Lombok; Sm, Sumba; Am, Ambon [44]. Data have been normalized to the common level of analysis. On the whole, 26% of the total variance is represented: 15% by the first PC and 11% by the second PC.
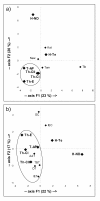
Figure 8
Principal component analysis of Y-chromosome haplogroup frequencies. (a) Comparison with Nepalese and Tibetan groups [37]; (b) Comparison with some Indian caste and tribal groups [15] where our data have been normalized to the Sengupta level of resolution. Populations: Kat, Kathmandu; New, Newar; Tam, Tamang; Tib, Tibet; DC Dravidian castes; IEC, Indo-European castes; AAT, Austro-Asiatic tribals; TBT, Tibeto-Burman tribals; DT, Dravidian tribals; IET, Indo-European tribals.
Figure 9
Histograms of the Indian local (Hgs: C5, F, H, L1, O2a1a1) and inter-regional (Hgs: L* and R) components observed in the populations of the present study compared with other Nepalese groups. Sample sizes are in parentheses. (a) Gayden et al. [37]
Similar articles
- COII/tRNA(Lys) intergenic 9-bp deletion and other mtDNA markers clearly reveal that the Tharus (southern Nepal) have Oriental affinities.
Passarino G, Semino O, Modiano G, Santachiara-Benerecetti AS. Passarino G, et al. Am J Hum Genet. 1993 Sep;53(3):609-18. Am J Hum Genet. 1993. PMID: 8102506 Free PMC article. - Revisiting the role of the Himalayas in peopling Nepal: insights from mitochondrial genomes.
Wang HW, Li YC, Sun F, Zhao M, Mitra B, Chaudhuri TK, Regmi P, Wu SF, Kong QP, Zhang YP. Wang HW, et al. J Hum Genet. 2012 Apr;57(4):228-34. doi: 10.1038/jhg.2012.8. Epub 2012 Mar 22. J Hum Genet. 2012. PMID: 22437208 - Autosomal and uniparental portraits of the native populations of Sakha (Yakutia): implications for the peopling of Northeast Eurasia.
Fedorova SA, Reidla M, Metspalu E, Metspalu M, Rootsi S, Tambets K, Trofimova N, Zhadanov SI, Hooshiar Kashani B, Olivieri A, Voevoda MI, Osipova LP, Platonov FA, Tomsky MI, Khusnutdinova EK, Torroni A, Villems R. Fedorova SA, et al. BMC Evol Biol. 2013 Jun 19;13:127. doi: 10.1186/1471-2148-13-127. BMC Evol Biol. 2013. PMID: 23782551 Free PMC article. - Ancient migration routes of Austronesian-speaking populations in oceanic Southeast Asia and Melanesia might mimic the spread of nasopharyngeal carcinoma.
Trejaut J, Lee CL, Yen JC, Loo JH, Lin M. Trejaut J, et al. Chin J Cancer. 2011 Feb;30(2):96-105. doi: 10.5732/cjc.010.10589. Chin J Cancer. 2011. PMID: 21272441 Free PMC article. Review. - Review of Croatian genetic heritage as revealed by mitochondrial DNA and Y chromosomal lineages.
Pericić M, Barać Lauc L, Martinović Klarić I, Janićijević B, Rudan P. Pericić M, et al. Croat Med J. 2005 Aug;46(4):502-13. Croat Med J. 2005. PMID: 16100752 Review.
Cited by
- Y-STR diversity in the Himalayas.
Gayden T, Chennakrishnaiah S, La Salvia J, Jimenez S, Regueiro M, Maloney T, Persad PJ, Bukhari A, Perez A, Stojkovic O, Herrera RJ. Gayden T, et al. Int J Legal Med. 2011 May;125(3):367-75. doi: 10.1007/s00414-010-0485-x. Epub 2010 Jul 21. Int J Legal Med. 2011. PMID: 20652582 - Inland post-glacial dispersal in East Asia revealed by mitochondrial haplogroup M9a'b.
Peng MS, Palanichamy MG, Yao YG, Mitra B, Cheng YT, Zhao M, Liu J, Wang HW, Pan H, Wang WZ, Zhang AM, Zhang W, Wang D, Zou Y, Yang Y, Chaudhuri TK, Kong QP, Zhang YP. Peng MS, et al. BMC Biol. 2011 Jan 10;9:2. doi: 10.1186/1741-7007-9-2. BMC Biol. 2011. PMID: 21219640 Free PMC article. - Genetic structure of Qiangic populations residing in the western Sichuan corridor.
Wang CC, Wang LX, Shrestha R, Zhang M, Huang XY, Hu K, Jin L, Li H. Wang CC, et al. PLoS One. 2014 Aug 4;9(8):e103772. doi: 10.1371/journal.pone.0103772. eCollection 2014. PLoS One. 2014. PMID: 25090432 Free PMC article. - The paternal ancestry of Uttarakhand does not imitate the classical caste system of India.
Negi N, Tamang R, Pande V, Sharma A, Shah A, Reddy AG, Vishnupriya S, Singh L, Chaubey G, Thangaraj K. Negi N, et al. J Hum Genet. 2016 Feb;61(2):167-72. doi: 10.1038/jhg.2015.121. Epub 2015 Oct 29. J Hum Genet. 2016. PMID: 26511066 - An updated phylogeny of the human Y-chromosome lineage O2a-M95 with novel SNPs.
Zhang X, Kampuansai J, Qi X, Yan S, Yang Z, Serey B, Sovannary T, Bunnath L, Aun HS, Samnom H, Kutanan W, Luo X, Liao S, Kangwanpong D, Jin L, Shi H, Su B. Zhang X, et al. PLoS One. 2014 Jun 27;9(6):e101020. doi: 10.1371/journal.pone.0101020. eCollection 2014. PLoS One. 2014. PMID: 24972021 Free PMC article.
References
- Terrenato L, Shrestha S, Dixit KA, Luzzatto L, Modiano G, Morpurgo G, Arese P. Decreased malaria morbidity in the Tharu people compared to sympatric populations in Nepal. Ann Trop Med Parasitol. 1988;82:1–11. - PubMed
- Bista DB. People of Nepal. Kathmandu, Nepal: Ratna Pustak Bhandar; 1980.
- Passarino G, Semino O, Pepe G, Shrestha SL, Modiano G, Santachiara Benerecetti AS. MtDNA polymorphisms among Tharus of eastern Terai (Nepal) Gene Geography. 1992;6:139–147. - PubMed
Publication types
MeSH terms
Substances
LinkOut - more resources
Full Text Sources


