AKT-independent signaling downstream of oncogenic PIK3CA mutations in human cancer - PubMed (original) (raw)
. 2009 Jul 7;16(1):21-32.
doi: 10.1016/j.ccr.2009.04.012.
David A Barbie, Michael A Davies, Rosalia Rabinovsky, Chontelle J McNear, Jessica J Kim, Bryan T Hennessy, Hsiuyi Tseng, Panisa Pochanard, So Young Kim, Ian F Dunn, Anna C Schinzel, Peter Sandy, Sebastian Hoersch, Qing Sheng, Piyush B Gupta, Jesse S Boehm, Jan H Reiling, Serena Silver, Yiling Lu, Katherine Stemke-Hale, Bhaskar Dutta, Corwin Joy, Aysegul A Sahin, Ana Maria Gonzalez-Angulo, Ana Lluch, Lucia E Rameh, Tyler Jacks, David E Root, Eric S Lander, Gordon B Mills, William C Hahn, William R Sellers, Levi A Garraway
Affiliations
- PMID: 19573809
- PMCID: PMC2752826
- DOI: 10.1016/j.ccr.2009.04.012
AKT-independent signaling downstream of oncogenic PIK3CA mutations in human cancer
Krishna M Vasudevan et al. Cancer Cell. 2009.
Abstract
Dysregulation of the phosphatidylinositol 3-kinase (PI3K) signaling pathway occurs frequently in human cancer. PTEN tumor suppressor or PIK3CA oncogene mutations both direct PI3K-dependent tumorigenesis largely through activation of the AKT/PKB kinase. However, here we show through phosphoprotein profiling and functional genomic studies that many PIK3CA mutant cancer cell lines and human breast tumors exhibit only minimal AKT activation and a diminished reliance on AKT for anchorage-independent growth. Instead, these cells retain robust PDK1 activation and membrane localization and exhibit dependency on the PDK1 substrate SGK3. SGK3 undergoes PI3K- and PDK1-dependent activation in PIK3CA mutant cancer cells. Thus, PI3K may promote cancer through both AKT-dependent and AKT-independent mechanisms. Knowledge of differential PI3K/PDK1 signaling could inform rational therapeutics in cancers harboring PIK3CA mutations.
Figures
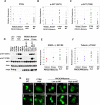
Figure 1
PTEN-null and _PIK3CA_-mutant cancer cells show different steady-state AKT pathway activation patterns. (A-C) Quantitative RPPA protein expression levels were determined in NCI60 cells showing loss of PTEN (PTEN-null) (green), helical PIK3CA mutation (Helical) (red), kinase PIK3CA mutation (Kinase) (blue) or a wild-type pattern for PTEN and PIK3CA (WT/WT) (gray). Relative protein levels of PTEN (A), p-AKT (Ser473) (B) and p-AKT (Thr308) (C) are shown. The diminished PTEN protein levels in PTEN-null cells are statistically significant (p < 0.001 when compared to both _PIK3CA_-mutant and “wild type” cells). PTEN-null cell lines have higher p-AKT (Ser473) and p-AKT (Thr308) levels than _PIK3CA_-mutant lines (p = 0.0006 and p = 0.002, respectively) or WT/WT lines (p = 0.0002 and p = 0.0003, respectively). The _PIK3CA_-mutant cell lines do not differ significantly from the WT/WT cell lines (p = 0.62 and p = 0.25, respectively, for each p-AKT residue). (D) Immunoblot analysis of AKT phosphorylation (p-AKT) at Ser473 and Thr308 across a panel of PTEN-null or _PIK3CA_-mutant cancer cell lines. (E, F) Quantitative RPPA levels were also determined for p-GSK3-α/β (E) p-Tuberin and (F). PTEN-null cells show higher phosphorylation of both AKT substrates than _PIK3CA_-mutant cells (p = 0.003 and p = 0.002, respectively) and WT/WT lines (p = 0.003 and 0.001, respectively). (G) Fluorescence microscopy of transient GFP-FOXO1 expression in PTEN-null or _PIK3CA_-mutant cancer cell lines. Lines with high p-AKT or low p-AKT are indicated. Scale bars = 30 μM.
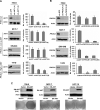
Figure 2
PTEN-null and _PIK3CA_-mutant cells show differential dependency on AKT for cell viability and anchorage-independent growth. (A, B) Anchorage-independent growth following lentiviral RNAi knockdown of AKT1 (A) or PIK3CA (B) in PTEN-null (786−0), _PIK3CA_-mutant cells with low p-AKT (MCF-7 and SW-948) and _PIK3CA_-mutant cells with high p-AKT (T47D). For each gene, knockdown efficacy of two independent shRNAs was measured by Western blot (left), and colony formation in soft agar was enumerated (right). Data are mean +/− SD; each experiment was performed in triplicate. (C) Expression of HA-tagged dominant negative AKT (DN-AKT) in PTEN-null (786−0), or _PIK3CA_-mutant cells with low p-AKT (MCF-7 and HCT15). Immunoblot analysis for DN-AKT expression (top) and effects of DN-AKT on anchorage-independent growth (bottom) are shown.
Figure 3
AKT subcellular localization, phosphatidylinositide studies, and PTEN regulation in PIK3CA-mutant cells. (A) Immunofluorescence studies of transient PH-AKT-GFP expression (top panel) and PI(3,4,5)P3 levels (bottom panel), and are shown for “wild-type” (DU145), PTEN-null (786−0), _PIK3CA_-mutant cells with low p-AKT (MCF-7 and SW-948) and _PIK3CA_-mutant cells with high p-AKT (HCC1954 and T47D). Scale bars = 30 μM. (B, C) Relative levels of PtdIns(3,4,5)P3 (B) and PtdIns(3,4)P2 (C) are shown in “wild-type” (DU145), PTEN-null (786−0 and SF-539), _PIK3CA_-mutant cells with low p-AKT (MCF-7, HCT-15 and SW-948) and _PIK3CA_-mutant cells with high p-AKT (HCC1954, MDA-MB453 and T47D). Error bars represent standard deviations of the mean for each cell line group. (D) Immunoblot analysis of AKT phosphorylation (p-AKT) at Ser473 and Thr308 following PTEN knockdown in “wild-type” (DU145) or PIK3CA-mutant cells (MCF-7).
Figure 4
PDK1-dependent signaling and tumorigenicity in _PIK3CA_-mutant cells. (A) RPPA expression of phospho-PDK1 (S241) in 224 hormone receptor positive human breast tumors. Samples were grouped according to the type of PIK3CA mutation (helical or kinase) or “no mutation.” (B) Immunoblotting studies of phospho-PDK1 (S241) and total PDK1 are shown in “wild-type” (MALME and DU145), _PIK3CA_helical (MCF-7, SW-948, HCT-15), _PIK3CA_kinase (BT-20, HCC-1954, MDA-MB-453), and PTEN-null cells (786−0, SF-539). (C) Quantification of the immunoblot signal as average intensities + SD are shown for the cell lines in (B) above. (D, E) Anchorage-independent growth following lentiviral RNAi knockdown of PDK1 in _PIK3CA_-mutant cells with low p-AKT (MCF-7) (D) or high p-AKT (T47D) (E). Knockdown efficacy of two independent shRNAs was measured by Western blot (left), and colony formation in soft agar was enumerated (right). Data are mean +/− SD; each experiment was performed in triplicate.
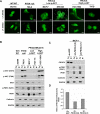
Figure 5
PI3K-dependent membrane association of PDK1 in _PIK3CA_-mutant cells. (A) Fluorescence microscopy of transient PH-PDK1-GFP expression is shown for serum-starved “wild-type” (DU145), PTEN-null (786−0), _PIK3CA_-mutant cells with low p-AKT (MCF-7 and SW-948) and _PIK3CA_-mutant cells with high p-AKT (HCC1954 and T47D). Scale bars = 30 μM. (B) Immunoblotting studies of cytosolic (Cy) and membrane (M) fractions prepared from serum-starved “wild-type” (ACHN), PTEN-null (786−0), or _PIK3CA_–mutant cells (MCF-7, HCT-15, and HCC-1954) are shown. (C) Immunoblotting studies of cytosolic (Cy) and membrane (M) fractions prepared following shRNA knockdown of p110α (sh-PIK3CA) or control (sh-GFP) in serum-starved MCF-7 cells. (For (B) and (C), Antibodies recognizing p-AKT (S473), AKT1, p-PDK1 (S241), PDK1, Cadherin and GAPDH were used.) (D) Quantification of the immunoblot signal is shown as a normalized ratio of membrane/cytosolic PDK1 (total) for the blot in (C) above.
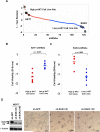
Figure 6
SGK3 transduces an AKT-independent signal in _PIK3CA_-mutant cells. (A) Distribution of 120 hairpins against 20 PDK1 substrates ranked according to the t-test statistics applied to cell viability data. The tails of the curve represent hairpins that are selectively lethal in 3 _PIK3CA_-mutant cell lines with high p-AKT (red) compared to 3 _PIK3CA_-mutant cell lines with low p-AKT (blue). Multiple hairpins targeting AKT1 or SGK3 in the top 10% of hairpins distinguishing each class are indicated (circles). (B,C) Cell viability data is shown for the top-scoring, knockdown-validated AKT1 hairpins (B) and SGK3 hairpins (C) in _PIK3CA_-mutant lines with high vs. low p-AKT levels. (D) SGK3 expression by immunoblot analysis (left panel) and cell viability (right panel) following lentiviral RNAi knockdown of SGK3 in MCF-7 cells (_PIK3CA_-mutant, low p-AKT) (NS: non-specific band). Scale bars = 500 μM.
Figure 7
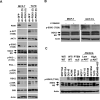
(A) Immunoblot analysis of MCF-7 (_PIK3CA_-mutant, low p-AKT) and T47D cells (_PIK3CA_-mutant, high p-AKT) stably expressing shRNAs against GFP (control) or PDK1. Antibodies recognizing phospho-AKT (T308), AKT1, phospho-SGK3 (T320), SGK3, phospho-PKC ζ (T410), PKC ζ, phospho-RSK (S227), RSK2, phospho-p70 S6 kinase (T229), p70 S6 kinase, and actin were used. (B) Immunoblot analysis of SGK3 phosphorylation at Thr320 (p-SGK3(T320)) in the absence or presence of LY294002 is shown for MCF-7 and HCT-15 cells (_PIK3CA_-mutant, low p-AKT). (C) Immunoblot analysis of SGK3 phosphorylation (p-SGK3(T320)) across a panel of PI3K pathway “wild-type”, PTEN-null or _PIK3CA_-mutant cancer cell lines. Non-transformed lines (MCF-10A and MCF-12A) are included as negative controls (NS: non-specific band).
Similar articles
- An integrative genomic and proteomic analysis of PIK3CA, PTEN, and AKT mutations in breast cancer.
Stemke-Hale K, Gonzalez-Angulo AM, Lluch A, Neve RM, Kuo WL, Davies M, Carey M, Hu Z, Guan Y, Sahin A, Symmans WF, Pusztai L, Nolden LK, Horlings H, Berns K, Hung MC, van de Vijver MJ, Valero V, Gray JW, Bernards R, Mills GB, Hennessy BT. Stemke-Hale K, et al. Cancer Res. 2008 Aug 1;68(15):6084-91. doi: 10.1158/0008-5472.CAN-07-6854. Cancer Res. 2008. PMID: 18676830 Free PMC article. - 3-phosphoinositide-dependent kinase 1 controls breast tumor growth in a kinase-dependent but Akt-independent manner.
Gagliardi PA, di Blasio L, Orso F, Seano G, Sessa R, Taverna D, Bussolino F, Primo L. Gagliardi PA, et al. Neoplasia. 2012 Aug;14(8):719-31. doi: 10.1593/neo.12856. Neoplasia. 2012. PMID: 22952425 Free PMC article. - 3-Phosphoinositide-dependent kinase 1 potentiates upstream lesions on the phosphatidylinositol 3-kinase pathway in breast carcinoma.
Maurer M, Su T, Saal LH, Koujak S, Hopkins BD, Barkley CR, Wu J, Nandula S, Dutta B, Xie Y, Chin YR, Kim DI, Ferris JS, Gruvberger-Saal SK, Laakso M, Wang X, Memeo L, Rojtman A, Matos T, Yu JS, Cordon-Cardo C, Isola J, Terry MB, Toker A, Mills GB, Zhao JJ, Murty VV, Hibshoosh H, Parsons R. Maurer M, et al. Cancer Res. 2009 Aug 1;69(15):6299-306. doi: 10.1158/0008-5472.CAN-09-0820. Epub 2009 Jul 14. Cancer Res. 2009. PMID: 19602588 Free PMC article. - Deregulation of the EGFR/PI3K/PTEN/Akt/mTORC1 pathway in breast cancer: possibilities for therapeutic intervention.
Davis NM, Sokolosky M, Stadelman K, Abrams SL, Libra M, Candido S, Nicoletti F, Polesel J, Maestro R, D'Assoro A, Drobot L, Rakus D, Gizak A, Laidler P, Dulińska-Litewka J, Basecke J, Mijatovic S, Maksimovic-Ivanic D, Montalto G, Cervello M, Fitzgerald TL, Demidenko Z, Martelli AM, Cocco L, Steelman LS, McCubrey JA. Davis NM, et al. Oncotarget. 2014 Jul 15;5(13):4603-50. doi: 10.18632/oncotarget.2209. Oncotarget. 2014. PMID: 25051360 Free PMC article. Review. - Oncogenic PI3K and its role in cancer.
Samuels Y, Ericson K. Samuels Y, et al. Curr Opin Oncol. 2006 Jan;18(1):77-82. doi: 10.1097/01.cco.0000198021.99347.b9. Curr Opin Oncol. 2006. PMID: 16357568 Review.
Cited by
- Targeting the PI3K pathway for cancer therapy.
Sadeghi N, Gerber DE. Sadeghi N, et al. Future Med Chem. 2012 Jun;4(9):1153-69. doi: 10.4155/fmc.12.56. Future Med Chem. 2012. PMID: 22709255 Free PMC article. Review. - A renewable tissue resource of phenotypically stable, biologically and ethnically diverse, patient-derived human breast cancer xenograft models.
Zhang X, Claerhout S, Prat A, Dobrolecki LE, Petrovic I, Lai Q, Landis MD, Wiechmann L, Schiff R, Giuliano M, Wong H, Fuqua SW, Contreras A, Gutierrez C, Huang J, Mao S, Pavlick AC, Froehlich AM, Wu MF, Tsimelzon A, Hilsenbeck SG, Chen ES, Zuloaga P, Shaw CA, Rimawi MF, Perou CM, Mills GB, Chang JC, Lewis MT. Zhang X, et al. Cancer Res. 2013 Aug 1;73(15):4885-97. doi: 10.1158/0008-5472.CAN-12-4081. Epub 2013 Jun 4. Cancer Res. 2013. PMID: 23737486 Free PMC article. - Somatic mutation profiling and associations with prognosis and trastuzumab benefit in early breast cancer.
Loi S, Michiels S, Lambrechts D, Fumagalli D, Claes B, Kellokumpu-Lehtinen PL, Bono P, Kataja V, Piccart MJ, Joensuu H, Sotiriou C. Loi S, et al. J Natl Cancer Inst. 2013 Jul 3;105(13):960-7. doi: 10.1093/jnci/djt121. Epub 2013 Jun 5. J Natl Cancer Inst. 2013. PMID: 23739063 Free PMC article. Clinical Trial. - Targeting the PI3K/Akt/mTOR pathway for breast cancer therapy.
Cidado J, Park BH. Cidado J, et al. J Mammary Gland Biol Neoplasia. 2012 Dec;17(3-4):205-16. doi: 10.1007/s10911-012-9264-2. Epub 2012 Aug 4. J Mammary Gland Biol Neoplasia. 2012. PMID: 22865098 Free PMC article. Review. - Therapeutic targeting of the phosphatidylinositol 3-kinase signaling pathway: novel targeted therapies and advances in the treatment of colorectal cancer.
Yu M, Grady WM. Yu M, et al. Therap Adv Gastroenterol. 2012 Sep;5(5):319-37. doi: 10.1177/1756283X12448456. Therap Adv Gastroenterol. 2012. PMID: 22973417 Free PMC article.
References
- Alessi DR, James SR, Downes CP, Holmes AB, Gaffney PR, Reese CB, Cohen P. Characterization of a 3-phosphoinositide-dependent protein kinase which phosphorylates and activates protein kinase Balpha. Curr Biol. 1997;7:261–269. - PubMed
- Barbareschi M, Buttitta F, Felicioni L, Cotrupi S, Barassi F, Del Grammastro M, Ferro A, Dalla Palma P, Galligioni E, Marchetti A. Different prognostic roles of mutations in the helical and kinase domains of the PIK3CA gene in breast carcinomas. Clin Cancer Res. 2007;13:6064–6069. - PubMed
- Bayascas JR, Leslie NR, Parsons R, Fleming S, Alessi DR. Hypomorphic mutation of PDK1 suppresses tumorigenesis in PTEN(+/−) mice. Curr Biol. 2005;15:1839–1846. - PubMed
- Blend MJ, Stastny JJ, Swanson SM, Brechbiel MW. Labeling anti-HER2/neu monoclonal antibodies with 111In and 90Y using a bifunctional DTPA chelating agent. Cancer Biother Radiopharm. 2003;18:355–363. - PubMed
- Boehm JS, Zhao JJ, Yao J, Kim SY, Firestein R, Dunn IF, Sjostrom SK, Garraway LA, Weremowicz S, Richardson AL, et al. Integrative genomic approaches identify IKBKE as a breast cancer oncogene. Cell. 2007;129:1065–1079. - PubMed
Publication types
MeSH terms
Substances
Grants and funding
- T32CA09172-33/CA/NCI NIH HHS/United States
- R01 CA085912/CA/NCI NIH HHS/United States
- P01CA050661/CA/NCI NIH HHS/United States
- P30CA14051/CA/NCI NIH HHS/United States
- R33 CA128625/CA/NCI NIH HHS/United States
- P30 CA014051/CA/NCI NIH HHS/United States
- P50 CA098258/CA/NCI NIH HHS/United States
- U54 CA112967/CA/NCI NIH HHS/United States
- DP2 OD002750/OD/NIH HHS/United States
- P50CA112967/CA/NCI NIH HHS/United States
- T32 CA009172/CA/NCI NIH HHS/United States
- R01CA085912/CA/NCI NIH HHS/United States
- WT_/Wellcome Trust/United Kingdom
- P50CA093459/CA/NCI NIH HHS/United States
- R33CA128625/CA/NCI NIH HHS/United States
- P01 CA050661/CA/NCI NIH HHS/United States
- P50 CA093459/CA/NCI NIH HHS/United States
LinkOut - more resources
Full Text Sources
Other Literature Sources
Medical
Research Materials
Miscellaneous
