Lifespan profiles of Alzheimer's disease-associated genes and products in monkeys and mice - PubMed (original) (raw)
Comparative Study
Lifespan profiles of Alzheimer's disease-associated genes and products in monkeys and mice
Remi Dosunmu et al. J Alzheimers Dis. 2009.
Abstract
Alzheimer's disease (AD) is characterized by plaques of amyloid-beta (Abeta) peptide, cleaved from amyloid-beta protein precursor (AbetaPP). Our hypothesis is that lifespan profiles of AD-associated mRNA and protein levels in monkeys would differ from mice and that differential lifespan expression profiles would be useful to understand human AD pathogenesis. We compared profiles of AbetaPP mRNA, AbetaPP protein, and Abeta levels in rodents and primates. We also tracked a transcriptional regulator of the AbetaPP gene, specificity protein 1 (SP1), and the beta amyloid precursor cleaving enzyme (BACE1). In mice, AbetaPP and SP1 mRNA and their protein products were elevated late in life; Abeta levels declined in old age. In monkeys, SP1, AbetaPP, and BACE1 mRNA declined in old age, while protein products and Abeta levels rose. Proteolytic processing in both species did not match production of Abeta. In primates, AbetaPP and SP1 mRNA levels coordinate, but an inverse relationship exists with corresponding protein products as well as Abeta levels. Comparison of human DNA and mRNA sequences to monkey and mouse counterparts revealed structural features that may explain differences in transcriptional and translational processing. These findings are important for selecting appropriate models for AD and other age-related diseases.
Conflict of interest statement
Disclosure Statement. The authors state they have no actual or potential conflicts of interest concerning the material of this report.
Figures
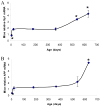
Fig. 1. Lifetime mRNA expression changes in AD related genes (Sp1, AβPP) in the mouse brain cortex
Relative quantification was measured by using 7500 Real–Time PCR System (Applied Biosystems, CA) with β–actin serving as the endogenous control. A) Relative Sp1 mRNA signal. B) Relative AβPP mRNA signal. Each data point in the curve is the mean + SEM (n=3-4 animals). “*” denotes significant difference for SP1 or AβPP mRNA time point when compared to that of PND 365.
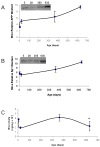
Fig. 2. Lifetime profile of AD related proteins (AβPP, SP1 Aβ) in the mouse brain
Protein from cortical tissue of wild–type mice was isolated, equal protein amounts were loaded and probed with 22C11 AβPP N–terminus antibody with SDS–PAGE western blot analysis as described in the methods section. The SP1 antibody used is mentioned in the methods section. Protein was also used to measure Aβ 1–40 by a sandwich ELISA assay (IBL, Japan). Six time points are shown. Representative blots are shown in insets for western analysis. A) Relative AβPP levels; B) Relative SP1 levels; C) Aβ40 levels. Each data point in the curve is the mean + SEM (n=3 animals). “*” denotes significant difference between Aβ levels at PND 630 as compared to PND 365. Western blot results were normalized to β–actin signal.
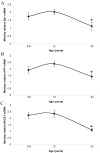
Fig. 3. Lifespan mRNA expression changes in AD related genes (Sp1, AβPP, BACE1) in the primate brain cortex
Relative quantification was measured by using 7500 Real–Time PCR System (Applied Biosystems, CA) with GAPDH serving as the endogenous control. Three time points are shown. Representative blots are shown in insets for western analysis. A) Relative AβPP mRNA. B) Relative SP1 mRNA. C) Relative BACE1 mRNA. Each data point in the curve is the mean + SEM (n=3 monkeys). “*” denotes significant difference for SP1 or AβPP mRNA time point when compared to 12 years age.
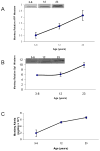
Fig. 4. Lifespan profile of AD related proteins (AβPP, SP1, and Aβ) in the primate brain
Protein from cortical tissue of Cynomolgus primate was isolated and probed with 22C11 AβPP N–terminus antibody with SDS–PAGE western blot analysis as described in the text. The SP1 antibody used is mentioned in the methods section. Protein was also used to measure Beta amyloid (Aβ) 1–40 using an ELISA assay (IBL, Japan). A) Relative AβPP protein signal; B) Relative SP1 signal; C. Aβ40 levels. Each data point in the curve is the mean + SEM (n=3 monkeys). Western blot results were normalized to β–actin signal.
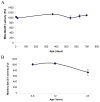
Fig. 5. Lifespan profile of BACE1 secretase activity in the mouse and primate brain
Protein from cortical tissue of mouse and Cynomolgus primate was isolated and BACE1 activity measured using the BACE1 activity assay kit (R&D Systems, Inc., MN). The y–axis reports raw intensity numbers from fluorescence spectrophotometry. A) BACE1 activity in mice at six time points. B) BACE1 activity in monkeys at three time points. Each data point in the curve is the mean + SEM (n=3 animals). “*” denotes significant difference for SP1 or AβPP mRNA time point when compared to PND 365 for mouse or 12 years age for monkey.
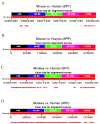
Fig. 6. Genomic homology of mouse Sp1 and AβPP with human Sp1 and AβPP
Genomic reference sequences for human Sp1 and AβPP were used to BLAST the mouse reference genomic assembly as described in the text. Diagram represents coverage of homological regions over entire genomic sequences. Colors indicate percent homology as indicated by keys on figure. A) Homology of mouse Sp1 vs. human Sp1. Numbers along alignment indicate position in human chromosomal genomic sequence. B) Homology of mouse AβPP vs. human AβPP. Numbers along alignment indicate position in human reference gene sequence [81]. C) Homology of monkey Sp1 vs. human Sp1. Numbers along alignment indicate position in human chromosomal genomic sequence. D) Homology of monkey AβPP vs. human AβPP. Numbers along alignment indicate position in human reference gene sequence [81].
Fig. 7. Homology of mouse and monkey Sp1 promoter sequences with human Sp1 sequence
Sequences of 4kb length upstream of the +1 TSS were taken from genomic reference sequences for mouse, rhesus monkey, and human Sp1, and ClustalX was used to align each of the monkey and mouse sequences to the human. Diagram represents percent homology of each non–human sequence with human sequence in a 50–bp window. A) Homology of mouse Sp1 promoter vs. human Sp1 promoter. B) Homology of monkey Sp1 promoter vs. human SP1 promoter.
Fig. 8. Relationship between mRNA and protein product levels of selected AD–related genes in mouse vs. monkey
Diagram illustrates levels of mRNA vs. protein product levels of SP1 and APP in animal models studied. Solid line indicates mRNA levels over lifespan while dashed line indicates protein levels over lifespan. For each species, mRNA and protein levels diverge from each other in later life, albeit in opposite directions when comparing species to species. A) Mouse mRNA and protein levels. B) Monkey mRNA and protein levels.
Similar articles
- Lamotrigine Reduces β-Site AβPP-Cleaving Enzyme 1 Protein Levels Through Induction of Autophagy.
Wu H, Lu MH, Wang W, Zhang MY, Zhu QQ, Xia YY, Xu RX, Yang Y, Chen LH, Ma QH. Wu H, et al. J Alzheimers Dis. 2015;46(4):863-76. doi: 10.3233/JAD-143162. J Alzheimers Dis. 2015. PMID: 25854934 - Mapping pathogenic processes contributing to neurodegeneration in Drosophila models of Alzheimer's disease.
Bergkvist L, Du Z, Elovsson G, Appelqvist H, Itzhaki LS, Kumita JR, Kågedal K, Brorsson AC. Bergkvist L, et al. FEBS Open Bio. 2020 Mar;10(3):338-350. doi: 10.1002/2211-5463.12773. Epub 2020 Jan 22. FEBS Open Bio. 2020. PMID: 31823504 Free PMC article. - New BACE1 Chimeric Peptide Inhibitors Selectively Prevent AβPP-β Cleavage Decreasing Amyloid-β Production and Accumulation in Alzheimer's Disease Models.
Resende R, Ferreira-Marques M, Moreira P, Coimbra JRM, Baptista SJ, Isidoro C, Salvador JAR, Dinis TCP, Pereira CF, Santos AE. Resende R, et al. J Alzheimers Dis. 2020;76(4):1317-1337. doi: 10.3233/JAD-200381. J Alzheimers Dis. 2020. PMID: 32597812 - Localization and Trafficking of Amyloid-β Protein Precursor and Secretases: Impact on Alzheimer's Disease.
Agostinho P, Pliássova A, Oliveira CR, Cunha RA. Agostinho P, et al. J Alzheimers Dis. 2015;45(2):329-47. doi: 10.3233/JAD-142730. J Alzheimers Dis. 2015. PMID: 25589722 Review. - Segregation of a missense mutation in the amyloid beta-protein precursor gene with familial Alzheimer's disease.
Goate A. Goate A. J Alzheimers Dis. 2006;9(3 Suppl):341-7. doi: 10.3233/jad-2006-9s338. J Alzheimers Dis. 2006. PMID: 16914872 Review.
Cited by
- Neuroprotective Strategies and Cell-Based Biomarkers for Manganese-Induced Toxicity in Human Neuroblastoma (SH-SY5Y) Cells.
Cahill CM, Sarang SS, Bakshi R, Xia N, Lahiri DK, Rogers JT. Cahill CM, et al. Biomolecules. 2024 May 31;14(6):647. doi: 10.3390/biom14060647. Biomolecules. 2024. PMID: 38927051 Free PMC article. - Genome-wide expression and methylation profiling in the aged rodent brain due to early-life Pb exposure and its relevance to aging.
Dosunmu R, Alashwal H, Zawia NH. Dosunmu R, et al. Mech Ageing Dev. 2012 Jun;133(6):435-43. doi: 10.1016/j.mad.2012.05.003. Epub 2012 May 18. Mech Ageing Dev. 2012. PMID: 22613225 Free PMC article. - Functional characterization of three single-nucleotide polymorphisms present in the human APOE promoter sequence: Differential effects in neuronal cells and on DNA-protein interactions.
Maloney B, Ge YW, Petersen RC, Hardy J, Rogers JT, Pérez-Tur J, Lahiri DK. Maloney B, et al. Am J Med Genet B Neuropsychiatr Genet. 2010 Jan 5;153B(1):185-201. doi: 10.1002/ajmg.b.30973. Am J Med Genet B Neuropsychiatr Genet. 2010. PMID: 19504470 Free PMC article. - Histone acetylation maps in aged mice developmentally exposed to lead: epigenetic drift and Alzheimer-related genes.
Eid A, Bihaqi SW, Hemme C, Gaspar JM, Hart RP, Zawia NH. Eid A, et al. Epigenomics. 2018 May;10(5):573-583. doi: 10.2217/epi-2017-0143. Epub 2018 May 3. Epigenomics. 2018. PMID: 29722544 Free PMC article.
References
- Tanzi RE, Bertram L. Alzheimer's disease: The latest suspect. Nature. 2008;454:706–708. - PubMed
- Selkoe DJ. Amyloid protein and Alzheimer's disease. Scientific American. 1991;265:68–66. 78. - PubMed
- Sambamurti K, Suram A, Venugopal C, Prakasam A, Zhou Y, Lahiri DK, Greig NH. A partial failure of membrane protein turnover may cause Alzheimer's disease: a new hypothesis. Current Alzheimer Research. 2006;3:81–90. - PubMed
- Lahiri DK, Farlow MR, Sambamurti K, Greig NH, Giacobini E, Schneider LS. A critical analysis of new molecular targets and strategies for drug developments in Alzheimer's disease. Current Drug Targets. 2003;4:97–112. - PubMed
- Goedert M, Spillantini MG. A century of Alzheimer's disease. Science. 2006;314:777–781. - PubMed
Publication types
MeSH terms
Substances
Grants and funding
- AG18379/AG/NIA NIH HHS/United States
- R01 AG018884-01A2/AG/NIA NIH HHS/United States
- R01 AG018884/AG/NIA NIH HHS/United States
- R01 AG018379-01/AG/NIA NIH HHS/United States
- R01 AG018884-05/AG/NIA NIH HHS/United States
- R01 AG018379-06/AG/NIA NIH HHS/United States
- ES013022/ES/NIEHS NIH HHS/United States
- R03 AG027246/AG/NIA NIH HHS/United States
- R21 ES013022/ES/NIEHS NIH HHS/United States
- R21 ES013022-03/ES/NIEHS NIH HHS/United States
- P20 RR016457/RR/NCRR NIH HHS/United States
- R01 AG018379-02/AG/NIA NIH HHS/United States
- R01 AG018379-03/AG/NIA NIH HHS/United States
- R01 AG018379-08/AG/NIA NIH HHS/United States
- ImNIH/Intramural NIH HHS/United States
- R01 AG018379-04/AG/NIA NIH HHS/United States
- R01 AG018884-07/AG/NIA NIH HHS/United States
- R01 AG018379/AG/NIA NIH HHS/United States
- P20 RR016457-040007/RR/NCRR NIH HHS/United States
- AG027246/AG/NIA NIH HHS/United States
- R01 AG018379-07/AG/NIA NIH HHS/United States
- R01 AG018884-03/AG/NIA NIH HHS/United States
- R01 AG018379-09/AG/NIA NIH HHS/United States
- R03 AG027246-02/AG/NIA NIH HHS/United States
- R01 AG018884-04/AG/NIA NIH HHS/United States
- R01 AG018379-05/AG/NIA NIH HHS/United States
- AG18884/AG/NIA NIH HHS/United States
- R01 AG018884-02/AG/NIA NIH HHS/United States
- P20RR016457/RR/NCRR NIH HHS/United States
- R01 AG018884-06A1/AG/NIA NIH HHS/United States
LinkOut - more resources
Full Text Sources
Medical
Research Materials
