CXCR3 deficiency increases susceptibility to genital herpes simplex virus type 2 infection: Uncoupling of CD8+ T-cell effector function but not migration - PubMed (original) (raw)
CXCR3 deficiency increases susceptibility to genital herpes simplex virus type 2 infection: Uncoupling of CD8+ T-cell effector function but not migration
Manoj Thapa et al. J Virol. 2009 Sep.
Abstract
CXCR3 is a G-protein-coupled receptor preferentially expressed by activated T cells, NK cells, and dendritic cells. Signaling through gamma interferon-regulated chemokines CXCL9, CXCL10, CXCL11, and CXCR3 plays a critical role in the immune response of many viral pathogens. However, the relevance of CXCR3 for optimal T-cell activation and the induction of regulatory transcription factors (i.e., T-bet and eomesodermin) relative to host immune defense against genital herpes simplex virus type 2 (HSV-2) infection have been poorly defined. In this study, we evaluated the requirement of CXCR3 expression during genital HSV-2 infection using mice deficient in CXCR3 (CXCR3(-/-)) along with wild-type (WT) controls, assessing the resistance of mice to viral infection and focusing on the cytokine/chemokine response, phenotypic analysis of recruited leukocytes, and functional analysis of CD8(+) T cells. CXCR3(-/-) mice showed a heightened sensitivity to infection compared to WT animals in terms of the viral burden in infected tissues as well as elevated mortality. The poor response of CXCR3(-/-) mice to viral infection was associated with reduced cytotoxic T-lymphocyte activity through the impairment of T-bet, perforin, and granzyme B expression by CD8(+) T cells. Corresponding with the defective cytolytic activity, a reduction in recruitment of plasmacytoid dendritic cells and CD80 expression in CD11c(+) dendritic cells in the draining lymph nodes of CXCR3(-/-) mice were detected. Collectively, the results provide a new perspective to CXCR3 signaling for the appropriate activation of CD8(+) T cells required for host defense against genital HSV-2 infection.
Figures
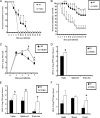
FIG. 1.
CXCR3−/− mice are highly susceptible to genital HSV-2 infection. (A and B) C57BL/6 (WT) and CXCR3−/− mice (14 mice/group) were rendered susceptible to infection using medroxyprogesterone acetate, infected with 20,000 PFU HSV-2/vagina (A) or 2,000 PFU HSV-2/vagina (B), and monitored for survival over 30 days p.i. The results are displayed as survival means ± standard errors of the means for each time point, summarized from three independent experiments. *, P was <0.05 when comparing WT and CXCR3−/− mice. (C) Virus titers obtained from vaginal lavage fluid from HSV-2 (2,000 PFU/vagina)-infected WT and CXCR3−/− mice (six mice/group) at the indicated times. *, P was <0.05 when comparing WT and CXCR3−/− mice. (D and E) Vaginal, spinal cord, and brain stem tissue were processed and assayed for viral titers on day 3 (D) and day 7 (E) p.i. *, P was <0.05 when comparing WT and CXCR3−/− mice. (F) Spinal cords were processed and dissected into three sections (cervical, thoracic, and lumbar) and assayed for viral titers. The viral titer is expressed as the mean log PFU ± standard error of the mean. The bars represent means ± standard errors of the means from three independent experiments. *, P was <0.05 when comparing WT and CXCR3−/− mice.
FIG. 2.
An increase in neuropathology is evident in HSV-2-infected CXCR3−/− mice. Following medroxyprogesterone acetate treatment, WT and CXCR3−/− mice (six mice/group) were infected with HSV-2 (2,000 PFU/vagina). On day 7 p.i., mice were exsanguinated, and the brain stem and spinal cord were removed from each mouse and processed for histological analysis using hematoxylin and eosin staining. Tissues from uninfected WT mice were used as a control. The magnification used is ×200. The data are representative of three independent experiments.
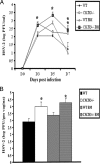
FIG. 3.
Viral titers of HSV-2-infected WT and CXCR3−/− BM chimera mice. (A) WT, CXCR3−/−, WT BM chimera, and CXCR3−/− BM chimera mice (nine mice/group) were infected with HSV-2 (2,000 PFU/vagina), and at the indicated time points, vaginal lavage fluid was collected and assayed for viral titers. *, P was <0.05 when comparing WT and CXCR3−/− mice. (B) Vaginal tissue collected from HSV-2-infected mice (nine mice/group) on day 7 p.i. was assayed for determination of the viral load. The viral titers are expressed as log PFU ± standard errors of the means. The bars represent means ± standard errors of the means from three independent experiments. *, P was <0.05 when comparing WT and CXCR3−/− mice.
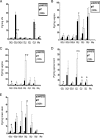
FIG. 4.
Chemokine/cytokine levels in the tissue of HSV-2-infected WT and CXCR3−/− mice. WT and CXCR3−/− mice (six mice/group) were infected with HSV-2 (2,000 PFU/vagina). The mice were exsanguinated at the indicated times p.i., and ILN (day 3) (A), vaginal tissue (day 3) (B), vaginal tissue (day 7) (C), spinal cords (day 7) (D), and brain stems (day 7) (E) were removed, processed, and assessed for the indicated analyte using a suspension array system or an ELISA (for CXCL9 and CXCL10). Samples were analyzed in duplicate, along with a standard provided to generate standard curves for each analyte. The weight of the tissue was used to normalize the amount of cytokine/chemokine per milligram of tissue weight, and bars represent the means ± standard errors of the means from two independent experiments. P was <0.01 (**) and <0.05 (*) when comparing the WT and CXCR3−/− mice.
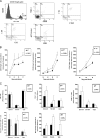
FIG. 5.
Leukocyte infiltration into HSV-2-infected tissue. (A) WT and CXCR3−/− mice (six mice/group) were infected with HSV-2 (2,000 PFU/vagina) and exsanguinated at the indicated time p.i., and tissues were removed, processed, and analyzed for CD45hi cell population and surface characteristics, as shown by the representative flow plots in the spinal cord indicating CD45hi gate cells, NK cells (NK1.1+ CD3−), CD4+ T cells (CD3+ CD4+), CD8+ T cells (CD3+ CD8+), and HSV gB-specific CD8+ T cells (CD8+ Tetramer+). (B) The absolute number of CD45hi cell population in vaginal, spinal cord, and brain stem tissue samples were determined by flow cytometry. The day 0 time point represents uninfected controls. *, P was <0.05 when comparing WT and CXCR3−/− mice. (C) The absolute number of NK cells, CD4+ T cells, CD8+ T cells, HSV gB-specific CD8+ T cells, and macrophages in infected tissues on day 7 p.i. were determined by flow cytometry. The bars represent standard errors of the means from three independent experiments. *, P was <0.05 when comparing WT and CXCR3−/− mice.
FIG. 6.
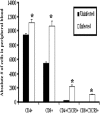
CXCR3 expression in peripheral blood T cells. Blood was drawn from uninfected WT or HSV-2-infected WT mice (six mice/group) on day 7 p.i. and processed to isolate cells. Purified cells were stained with anti-CXCR3, anti-CD4, or anti-CD8 and were analyzed using a flow cytometer, as described in Materials and Method. Bars represent means ± standard errors of the means from three independent experiments. *, P was <0.05 when comparing infected and uninfected mice.
FIG. 7.
CCR5 expression in HSV-2-infected T cells. Following medroxyprogesterone acetate treatment, WT and CXCR3−/− mice (six mice/group) were infected with HSV-2 (2,000 PFU/vagina). On day 7 p.i., mice were exsanguinated, and the ILN, vaginal tissue, brain stem, and spinal cord were removed from each mouse and processed for CCR5 expression by flow cytometry. Cells were stained with anti-CCR5, anti-CD4 or anti-CD8, and anti-CD45 and analyzed by flow cytometry. Only CD8+ CCR5+ cell data are shown. Bars represent the means ± standard errors of the means from three independent experiments.
FIG. 8.
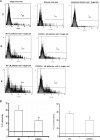
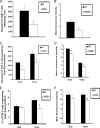
Cytolytic activity of CD8+ T cells is reduced in HSV-2-infected CXCR3−/− mice. WT and CXCR3−/− female mice (six mice/group) were infected with HSV-2 (2,000 PFU/vagina. On day 7 p.i., mice were exsanguinated, and spinal cords and ILN were processed and assessed for CTL activity. (A) Representative flow histograms showing background PI incorporation into CFSE-labeled HSV-2-infected target cells incubated without effector cells, effector cells incubated without HSV-2-infected target cells, target cells incubated with uninfected WT splenocytes (SC), and cytolytic activity of effector cells from spinal cords and lymph nodes (LN) of WT mice and CXCR3−/− mice. (B) Preparations from spinal cords (left) and ILN (right) were assayed for CTL activity at an effector-to-target cell ratio of 10:1. The dotted line indicates the background PI incorporation in CSFE-labeled targets cells. The bars represent the means ± standard errors of the means from two independent experiments. *, P was <0.05 when comparing WT and CXCR3−/− mice.
FIG. 9.
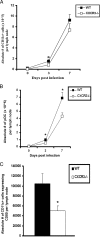
DC infiltration into the ILN of HSV-2-infected mice is reduced in the absence of CXCR3. WT and CXCR3−/− mice (six mice/group) were infected with HSV-2 (2,000 PFU/vagina) and subsequently exsanguinated at the indicated time points p.i. ILN samples were processed and analyzed for B220− CD11c+ DCs (A), plasmacytoid DCs (CD11c+ B220+) (B), and total CD11c+ DCs expressing CD80 (C) by flow cytometry on day 3 p.i. The data are displayed as the means ± standard errors of the means from three independent experiments. *, P was <0.05 when comparing WT and CXCR3−/− mice.
FIG. 10.
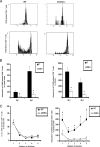
In vivo proliferation of virus-specific CD8+ T cells. CD8+ T cells from gBT.I-1 mice were enriched from spleen preparations by using MACS columns and labeled with CFSE (5 μM) for 15 min. Cells (1 × 10⁶) were transferred retro-orbitally (i.v.) to WT and CXCR3−/− mice (six mice/group) infected 24 h earlier with HSV-2 (2,000 PFU/vagina). At the indicated times, mice were exsanguinated, and ILN and spleens were processed to analyze the number of CFSE-labeled CD8+ T cells. (A) Representative histograms showing the divisions of CFSE-labeled CD8+ T cells from lymph nodes of WT and CXCR3−/− mice at 24 h (top) and 72 h (bottom) p.i. (B) Absolute number of CFSE-labeled CD8+ T cells in lymph nodes (left) and spleens (right) on day 1 and day 3 p.i., with results shown as the means ± standard errors of the means. (C) Percentage of dividing CFSE-labeled CD8+ T cells (left) and absolute number of those (right) in lymph nodes. Each point represents the mean ± standard error of the mean from two independent experiments. *, P was <0.05 when comparing WT and CXCR3−/− mice.
FIG. 11.
T-bet, perforin, and granzyme B expression by CD8+ T cells is reduced in HSV-2-infected CXCR3−/− mice. WT and CXCR3−/− mice (six mice/group) were infected with HSV-2 (2,000 PFU/vagina) and subsequently exsanguinated on day 7 p.i. The spleens were processed, and CD8+ T cells were purified using MACS columns. Enriched CD8+ T cells were analyzed for T-bet expression (A) and MFI of T-bet (log scale) by intracellular staining (B). ILN (C and D) and spinal cords (E and F) from WT and CXCR3−/− mice were processed and analyzed for the percentage of CD8+ T cells expressing granzyme B (Gran B) and perforin and for the MFI of granzyme B and perforin by intracellular staining, respectively. For spinal cord samples, lymphocytes were purified by Percoll gradient, and 100,000 cells were pooled from three animals and assayed in duplicate per experiment. Error bars represent the means ± standard errors of the means. *, P was <0.05 when comparing WT and CXCR3−/− mice.
FIG. 12.
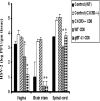
Adoptive transfer of transgenic CD8+ T cells protects CXCR3−/− mice. WT, gBT.I-1, and CXCR3−/− mice (six mice/group) were infected with HSV-2 (2,000 PFU/vagina), and spleens were removed on day 7 p.i and processed to isolate CD8+ T cells using MACS columns. The enriched CD8+ T cells (1 × 10⁶) from WT mice (WT CD8), transgenic mice gBT.I-1 (gBT-I.1 CD8), or CXCR3−/− mice (CXCR3−/− CD8) were separately transferred i.v. to CXCR3−/− mice (six mice/group) and subsequently infected with HSV-2 (2,000 PFU/vagina). WT and CXCR3−/− mice that received no cells at the time of infection were used as control groups. Mice were exsanguinated on day 7 p.i., and vaginas, spinal cords, and brain stems were removed and processed for viral content. The error bars represent standard errors of the means from two independent experiments. *, P was <0.05 when comparing groups of mice receiving cells and CXCR3−/− mice.
Similar articles
- CXCL10/CXCR3-Dependent Mobilization of Herpes Simplex Virus-Specific CD8+ TEM and CD8+ TRM Cells within Infected Tissues Allows Efficient Protection against Recurrent Herpesvirus Infection and Disease.
Srivastava R, Khan AA, Chilukuri S, Syed SA, Tran TT, Furness J, Bahraoui E, BenMohamed L. Srivastava R, et al. J Virol. 2017 Jun 26;91(14):e00278-17. doi: 10.1128/JVI.00278-17. Print 2017 Jul 15. J Virol. 2017. PMID: 28468883 Free PMC article. - Herpes Simplex Virus Type 2 Infection-Induced Expression of CXCR3 Ligands Promotes CD4+ T Cell Migration and Is Regulated by the Viral Immediate-Early Protein ICP4.
Zhang M, Deng X, Guan X, Geng L, Fu M, Zhang B, Chen R, Hu H, Hu K, Zhang D, Li M, Liu Y, Gong S, Hu Q. Zhang M, et al. Front Immunol. 2018 Dec 19;9:2932. doi: 10.3389/fimmu.2018.02932. eCollection 2018. Front Immunol. 2018. PMID: 30619292 Free PMC article. - Dysregulation of CXCR3 signaling due to CXCL10 deficiency impairs the antiviral response to herpes simplex virus 1 infection.
Wuest TR, Carr DJ. Wuest TR, et al. J Immunol. 2008 Dec 1;181(11):7985-93. doi: 10.4049/jimmunol.181.11.7985. J Immunol. 2008. PMID: 19017990 Free PMC article. - CXCR3 Ligands in Cancer and Autoimmunity, Chemoattraction of Effector T Cells, and Beyond.
Karin N. Karin N. Front Immunol. 2020 May 29;11:976. doi: 10.3389/fimmu.2020.00976. eCollection 2020. Front Immunol. 2020. PMID: 32547545 Free PMC article. Review. - Herpes simplex virus-2 in the genital mucosa: insights into the mucosal host response and vaccine development.
Lee AJ, Ashkar AA. Lee AJ, et al. Curr Opin Infect Dis. 2012 Feb;25(1):92-9. doi: 10.1097/QCO.0b013e32834e9a56. Curr Opin Infect Dis. 2012. PMID: 22143115 Review.
Cited by
- A multi-epitope/CXCL11 prime/pull coronavirus mucosal vaccine boosts the frequency and the function of lung-resident memory CD4+ and CD8+ T cells and enhanced protection against COVID-19-like symptoms and death caused by SARS-CoV-2 infection.
Zayou L, Prakash S, Dhanushkodi NR, Quadiri A, Ibraim IC, Singer M, Salem A, Shaik AM, Suzer B, Chilukuri A, Tran J, Nguyen PC, Sun M, Hormi-Carver KK, Belmouden A, Vahed H, Gil D, Ulmer JB, BenMohamed L. Zayou L, et al. J Virol. 2023 Dec 21;97(12):e0109623. doi: 10.1128/jvi.01096-23. Epub 2023 Dec 1. J Virol. 2023. PMID: 38038432 Free PMC article. - Herpes simplex virus interference with immunity: Focus on dendritic cells.
Ma F, Lf D, Ei T, Pa G. Ma F, et al. Virulence. 2021 Dec;12(1):2583-2607. doi: 10.1080/21505594.2021.1980990. Virulence. 2021. PMID: 34895058 Free PMC article. Review. - Local Immune Control of Latent Herpes Simplex Virus Type 1 in Ganglia of Mice and Man.
St Leger AJ, Koelle DM, Kinchington PR, Verjans GMGM. St Leger AJ, et al. Front Immunol. 2021 Sep 15;12:723809. doi: 10.3389/fimmu.2021.723809. eCollection 2021. Front Immunol. 2021. PMID: 34603296 Free PMC article. Review. - Plasmacytoid dendritic cells have divergent effects on HIV infection of initial target cells and induce a pro-retention phenotype.
Tong O, Duette G, O'Neil TR, Royle CM, Rana H, Johnson B, Popovic N, Dervish S, Brouwer MAE, Baharlou H, Patrick E, Ctercteko G, Palmer S, Lee E, Hunter E, Harman AN, Cunningham AL, Nasr N. Tong O, et al. PLoS Pathog. 2021 Apr 19;17(4):e1009522. doi: 10.1371/journal.ppat.1009522. eCollection 2021 Apr. PLoS Pathog. 2021. PMID: 33872331 Free PMC article. - "Non-Essential" Proteins of HSV-1 with Essential Roles In Vivo: A Comprehensive Review.
Dogrammatzis C, Waisner H, Kalamvoki M. Dogrammatzis C, et al. Viruses. 2020 Dec 23;13(1):17. doi: 10.3390/v13010017. Viruses. 2020. PMID: 33374862 Free PMC article. Review.
References
- Agostini, C., F. Calabrese, F. Rea, M. Facco, A. Tosoni, M. Loy, G. Binotto, M. Valente, L. Trentin, and G. Semenzato. 2001. CXCR3 and its ligand CXCL10 are expressed by inflammatory cells infiltrating lung allografts and mediate chemotaxis of cells at sites of rejection. Am. J. Pathol. 158:1703-1711. - PMC - PubMed
- Barry, M., and R. C. Bleackley. 2002. Cytotoxic T lymphocytes: all roads to death. Nat. Rev. Immunol. 2:401-409. - PubMed
- Bellner, L., F. Thoren, E. Nygren, J. A. Liljeqvist, A. Karlsson, and K. Eriksson. 2005. A proinflammatory peptide from herpes simplex virus type 2 glycoprotein G affects neutrophil, monocyte, and NK cell functions. J. Immunol. 174:2235-2241. - PubMed
- Carson, M. J., C. R. Reilly, J. G. Sutcliffe, and D. Lo. 1998. Mature macroglia resemble immature antigen-presenting cell. Glia 22:72-85. - PubMed
Publication types
MeSH terms
Substances
Grants and funding
- P20 RR017703/RR/NCRR NIH HHS/United States
- R01 AI067309/AI/NIAID NIH HHS/United States
- R01 AI067309-03/AI/NIAID NIH HHS/United States
- AI067309/AI/NIAID NIH HHS/United States
- P30 EY012190/EY/NEI NIH HHS/United States
- EY12190/EY/NEI NIH HHS/United States
LinkOut - more resources
Full Text Sources
Other Literature Sources
Medical
Research Materials
