Faithful expression of multiple proteins via 2A-peptide self-processing: a versatile and reliable method for manipulating brain circuits - PubMed (original) (raw)
Figure 1.
Reliable coexpression of heterologous proteins using 2A peptide bridges in cultured neurons. A, Top, Amino acid residues of 2A peptide from Thosea asigna virus. The cleavage site is indicated by the arrow. Amino acid residues in red were added to keep the C-terminal environment constant between different constructs. Bottom, Diagram of rAAV vector constructs. B, 2A-mediated self-processing in primary hippocampal neuron cultures. Western blots of protein extracts from rAAV-infected hippocampal neurons at DPI 10. The 40.8 kDa iCre2A fusion protein and the 27.3 kDa Venus were detected, and to a very small extent, the 68.1 kDa precursor full-length protein. I, Neurons infected with rAAV-Syn-iCre2A-Venus. II+III, Neurons coinfected with the activator virus rAAV-Syn-tTA and rAAV-Ptetbi-iCre-Venus. Ctrl, Noninfected neurons. C, Confocal images of primary hippocampal neurons infected with rAAV-Syn-iCre2A-Venus at DPI 10. Neurons coexpress cleaved and freely diffusible Venus (green) and nuclear restricted iCre (red, visualized with Cy3-coupled antibody), indicating that the 2A fusion construct was cleaved successfully in situ. Scale bars, 10 μm.
Figure 2.
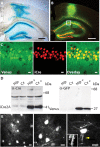
Functional and reliable coexpression using 2A peptide bridges in vivo and its application in life imaging. A, LacZ staining of a brain section from a Rosa26R mouse 2 weeks after stereotactic injection of rAAV-Syn-iCre2A-Venus, indicating that the released iCre2A protein was functional in vivo. Only infected brain regions showed blue LacZ signal. Scale bars, 500 μm. B, Confocal image of a brain section from a wild-type mouse injected with rAAV-Syn-iCre2A-Venus at DPI 14. Scale bars, 500 μm. C, Higher magnification of the boxed CA1 region. Coexpression of Venus (green) and iCre (red, visualized with Cy3-coupled antibody) was seen in virtually all infected neurons. Scale bars, 10 μm. D, Western blots of extracts from infected brain regions demonstrate near complete 2A peptide self-processing in vivo. Tissues were dissected from brains of noninjected and rAAV-Syn-iCre2A-Venus injected C57BL/6 mice at DPI 14. The 40.8 kDa iCre2A (left) and the 27.3 kDa Venus (right) were clearly detected, the 68.1 kDa full-length fusion protein was hardly visible. Hip, Hippocampus; Cx, cortex; +, infected with rAAV. E, In vivo two-photon images of a mouse injected with purified rAAV-Syn-iCre2A-Venus in somatosensory cortex at DPI 21. Cell bodies of neurons in superficial layers as well as their fine processes were imaged at a depth of 150–200 μm. Spines are indicated by arrowhead and zoom-in image is shown. Scale bars, 10 μm.
Figure 3.
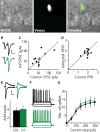
Unaltered electrophysiological properties of neurons expressing 2A constructs. Viral expression of 2A constructs had no effect on viability, spiking behavior, and synaptic transmission. A, Sparsely infected CA1 region in an acute hippocampal slice of rAAV-Syn-iCre2A-Venus at DPI 14–21, where Venus-expressing cells are clearly seen. B, AMPA-EPSCs recorded from a pair of CA1 neurons in response to paired pulses at −70 mV; control (black) and infected cell (green). Calibration: 20 pA, 40 ms. C, No difference in amplitudes of AMPA-EPSCs, which were −54.4 ± 9.2 pA and −57.4 ± 9.7 pA in control and infected neurons, respectively (n = 11 pairs, p = 0.68). D, No alterations in paired-pulse ratios (PPRs) of AMPA-EPSCs, which were 1.91 ± 0.09 and 1.79 ± 0.09 in control and infected neurons, respectively (n = 11 pairs, p = 0.56). E, AMPA- and NMDA-mediated EPSCs recorded from a pair of CA1 neurons at −70 mV and +40 mV; control (black) and infected cell (green). Calibration: 20 pA, 50 ms. There was no change in AMPA/NMDA ratios, which were 3.80 ± 0.63 (n = 6) and 4.09 ± 0.84 (n = 5) in control and infected neurons, respectively (p = 0.74). F, Indistinguishable electrical properties of control and infected CA1 neurons. Responses of a control (black) and an infected (green) neuron to current injections of −100, 0, +100, and +200 pA. Calibration: 20 mV, 100 ms. G, No difference in input–output curves (control, n = 8, infected, n = 7; p > 0.72).
Figure 4.
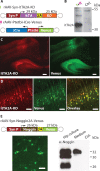
Use of 2A strategy to express other activators, fluorescent proteins, and secreted proteins. A, Diagram of the rAAVs for dual virus activator-responder approach to test for itTA and KO coexpression by 2A self-processing. B, Western blots of protein extracts from rAAV-Syn-itTA2A-KO-infected dissociated hippocampal neuron in culture at DPI 10. The 30.5 kDa itTA2A fusion protein was detected and 55.4 kDa full-length protein was faintly visible. I+II, Coinfected neurons. Ctrl, Noninfected neurons. C, Confocal images of a brain section from a mouse coinjected with rAAV-Syn-itTA2A-KO and the responder virus rAAV-Ptetbi-iCre-Venus 14 d after injection. Cells expressing itTA are labeled with the coexpressed red fluorescent protein KO. The itTA-driven Venus expression from the responder virus was detected by green fluorescence. Scale bars, 200 μm. D, At higher magnification, many neurons were fluorescently labeled in the infected cortical area, and most of them showed coexpression of KO and Venus as expected. Scale bars, 50 μm. E, Left, Dissociated primary hippocampal neurons at DPI 10 with rAAV-Syn-Noggin2A-Venus. Right, Western blots from rAAV-Syn-Noggin2A-Venus-infected primary hippocampal cultures at DPI 10. Three different forms of Noggin were detected in hippocampal neuron lysate, and only the 32 kDa secreted form was detected in the culture medium. Ctrl, Noninfected neurons.
Figure 5.
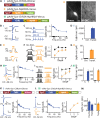
Functional coexpression of multiple membrane proteins and a fluorescent reporter. A, Left, Diagram of pAAV plasmids. Right, Infrared and fluorescence images of a plasmid-transfected pyramidal neuron in an organotypic slice expressing ChR2A-NpHR2A-Venus. Scale bar, 10 μm. B, Light responses in a transfected pyramidal neuron expressing ChR2A-tDimer in organotypic slices. Blue light (2 ms) elicited an inward current in voltage clamp (VC) and a spike in current-clamp mode (CC). Calibration: VC, 2000 pA, 100 ms; CC, 40 mV, 100 ms. C, Light-induced spiking at different stimulation frequencies, and summary of spike probability as a function of frequency in transfected cells (blue symbols; n = 13). No spikes were seen in control cells (black symbols; n = 6). D, Blue light-evoked ChR-currents were −2009 ± 304 pA (n = 9) versus −3 ± 1 pA (n = 6) in transfected versus control cells (p < 0.01). E, Light responses in a transfected pyramidal neuron expressing NpHR2A-Venus. Yellow light (50 ms) elicited an outward current in VC, and a hyperpolarization in CC mode. Calibration: VC, 40 pA, 50 ms; CC, 10 mV, 50 ms. F, Attenuation of spiking in pAAV-Syn-NpHR2A-Venus-transfected cells. Spikes evoked by current steps of increasing size in absence and presence of yellow light. The average spike ratio (number of spikes with/without light) was reduced for several step sizes in transfected (yellow symbols; n = 12) versus control cells (black symbols; n = 12, p < 0.02). G, Yellow light-evoked NpHR currents were 55 ± 7 pA (n = 12) versus 4 ± 1 pA (n = 12) in transfected versus control cells (p < 0.01). H, Light responses in a pyramidal neuron expressing ChR2A-NpHR2A-Venus. Blue light (2 ms) elicited a spike, and yellow light (50 ms) elicited a hyperpolarization. Calibration: Top, 20 mV, 100 ms; bottom, 2 mV, 100 ms. High fidelity spiking in transfected cells (blue symbols; n = 7), but not in control cells (black symbols; n = 9). I, In the same cells, NpHR activation attenuated neural firing evoked by short current steps. The average spike ratio was significantly reduced for the first two step sizes in transfected (yellow symbols; n = 8) versus control cells (black symbols; n = 6, p < 0.05). J, Blue light-evoked ChR-currents were −1803 ± 342 pA (n = 7) versus −10 ± 3 pA (n = 9) in transfected versus control cells (p < 0.01). Yellow light-evoked NpHR-currents were 111 ± 15 pA (n = 7) versus 4 ± 1 pA (n = 9) in transfected versus control cells (p < 0.01). K–M, Light responses of amygdala neurons in acute slices after rAAV infection in vivo. K, Blue light (2 ms) induced an inward current or spiking in a neuron infected with rAAV Syn-ChR2A-tDimer. Calibration: VC, 100 pA, 100 ms; CC, 20 mV, 100 ms. Spike probability of infected neurons at different stimulation frequencies (n = 18). L, Blue (2 ms) or yellow (50 ms) light evoked a spike or hyperpolarization, respectively, in a neuron infected with rAAV-Syn-ChR2A-NpHR2A-Venus. Calibration: Top, 20 mV, 100 ms; bottom, 0.5 mV, 100 ms. Blue light stimulation induced spiking with high fidelity (n = 8). Yellow light pulses effectively reduced spiking for the first two current steps compared with no light stimulation (n = 14, p < 0.01). M, Light-evoked currents in cells infected with either rAAV-Syn-ChR-2A-tDimer (double) or rAAV-Syn-ChR2A-NpHR2A-Venus (triple). Blue light-evoked currents were −365 ± 52 pA (double) and −243 ± 43 pA (triple). Yellow light-evoked currents were 11 ± 2 pA (triple).


