Regulation of the Drosophila Enhancer of split and invected-engrailed gene complexes by sister chromatid cohesion proteins - PubMed (original) (raw)
Regulation of the Drosophila Enhancer of split and invected-engrailed gene complexes by sister chromatid cohesion proteins
Cheri A Schaaf et al. PLoS One. 2009.
Abstract
The cohesin protein complex was first recognized for holding sister chromatids together and ensuring proper chromosome segregation. Cohesin also regulates gene expression, but the mechanisms are unknown. Cohesin associates preferentially with active genes, and is generally absent from regions in which histone H3 is methylated by the Enhancer of zeste [E(z)] Polycomb group silencing protein. Here we show that transcription is hypersensitive to cohesin levels in two exceptional cases where cohesin and the E(z)-mediated histone methylation simultaneously coat the entire Enhancer of split and invected-engrailed gene complexes in cells derived from Drosophila central nervous system. These gene complexes are modestly transcribed, and produce seven of the twelve transcripts that increase the most with cohesin knockdown genome-wide. Cohesin mutations alter eye development in the same manner as increased Enhancer of split activity, suggesting that similar regulation occurs in vivo. We propose that cohesin helps restrain transcription of these gene complexes, and that deregulation of similarly cohesin-hypersensitive genes may underlie developmental deficits in Cornelia de Lange syndrome.
Conflict of interest statement
Competing Interests: The authors have declared that no competing interests exist.
Figures
Figure 1. Enhancer of split and invected-engrailed gene complexes.
The Enhancer of split complex [E(spl)-C] (top) contains twelve genes (blue): HLHmδ, HLHmγ, HLHmβ, mα, m1, m2, HLHm3, m4, HLHm5, m6, HLHm7, and E(spl)m8. Nucleotide numbering is from the April 2006 genome (Berkeley Drosophila Genome Project). Genes above the scale are transcribed from left to right, and those below from right to left. Tracks above the gene diagrams show chromatin immunoprecipitation data for histone H3 lysine 27 trimethylation (H3K27Me3), RNA polymerase II (PolII) and combined cohesin and Nipped-B binding (cohesin-Nipped-B) for Sg4 (red) and BG3 cells (black) [15,56, Y.B. Schwartz, T.G. Kahn, P. Stenberg, K. Ohno, R. Bourgon, and V. Pirrotta, submitted). Bars below each track show regions that bind at p≤10−3, as determined using the MAT program. The bottom shows the same for the invected-engrailed complex.
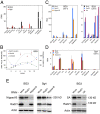
Figure 2. Regulation of the E(spl)-C and invected-engrailed complex by cohesin and Nipped-B.
(A) Transcripts for the E(spl)-C and invected-engrailed complex in BG3 (black) and Sg4 (red) cells quantified by RT-PCR and normalized to RpL32. The HLHmδ level in BG3 cells is defined as 1 unit, and all transcripts are normalized to this value. By comparison to genomic DNA standards, HLHmδ transcripts in BG3 cells are 8,400-fold less than RpL32 transcripts. BG3 values are the average of three RNA preparations, and Sg4 values are the average of two. Standard errors were calculated using all RT-PCR replicates from all biological replicates. (B) Rad21 RNAi time course, for Rad21 protein (blue diamonds, 100% starting), and fold-increases for the HLHmδ (red squares) and invected (green triangles) transcripts. Similar time courses are seen for engrailed and other E(spl)-C transcripts (not shown). Nipped-B knockdown shows similar time courses in Nipped-B protein and E(spl)-C and invected-engrailed transcripts (not shown), except that some E(spl)-C transcripts decrease on day 3 (Figure 3). (C) The left panel shows transcript levels in a typical experiment with mock RNAi-treated BG3 cells (black) and BG3 cells six days after Rad21 (blue) or Nipped-B (orange) RNAi treatment. The right panel shows transcript levels in another experiment with mock-treated BG3 cells (black), and BG3 cells treated with Rad21 (blue) or SA (purple) RNAi six days after treatment. (D) E(spl)-C and invected-engrailed transcript levels in mock-RNAi treated Sg4 cells (red), or Sg4 cells after two successive 3 day Rad21 (blue) or Nipped-B (orange) RNAi treatments. (E) Western blots of whole cell extracts after RNAi treatment. The three left panels show the same blot of BG3 extracts six days after RNAi probed with Nipped-B, Rad21 and Actin antisera. RNAi treatments are indicated at the tops of the lanes. The middle three panels show a blot of Sg4 extracts after two successive 3 day RNAi treatments. The right panels show a blot of BG3 extracts probed with SA, Rad21 and Actin antibodies six days after RNAi.
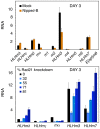
Figure 3. Biphasic changes in E(spl)-C transcripts after Nipped-B and Rad21 knockdown in BG3 cells.
The top panel shows E(spl)-C transcript levels in mock-treated (black) or Nipped-B RNAi treated (orange) BG3 cells three days after treatment. Similar results were obtained in all Nipped-B RNAi experiments. All levels are relative to HLHmδ in mock-treated cells. The data shown is an average of two RNAi experiments. The bottom panel shows the indicated E(spl)-C transcript levels three days after treatments with increasing amounts of Rad21 dsRNA that cause different extents of knockdown (mock, 0%; 0.7 µg per 3 cm well, 32%; 1.7 µg, 55%; 3.3 µg, 71%; 6.7 µg, 81%).
Figure 4. Effects of Polycomb on E(spl)-C and invected-engrailed transcripts in BG3 cells.
The graph shows transcript levels in mock-treated BG3 cells (black) and in Polycomb RNAi-treated cells (gray) six days after treatment. The western blot shows the Polycomb protein knockdown (∼70%) on day 6. All transcripts are relative to HLHmδ in mock control cells. Similar results were obtained in three experiments.
Figure 5. Effects of the CP190 insulator protein on E(spl)-C and invected-engrailed transcripts in BG3 cells.
The graph shows transcript levels in mock-treated BG3 cells (black), Rad21 (blue) and CP190 (green) RNAi-treated BG3 cells six days after treatment. The western blot shows the knockdown of CP190 protein on days 4 and 6 (∼90%). The unlabeled protein under 72 kD in size that is unaffected by RNAi is a cross-reacting cytoplasmic protein (Marek Bartkuhn and Rainer Renkawitz, personal communication). Similar results were obtained with 4 and 8 days after CP190 RNAi.
Figure 6. Dominant effects of Nipped-B and Rad21 mutations on _Notch_-split (Nspl-1) mutant phenotypes.
The top panel compares the eye phenotype in two wild-type backgrounds (wt a, Oregon R; wt b, Canton S), to flies heterozygous for Nipped-B407, Rad2136 (vtd36), and Rad21γ26-6 (vtdγ26-6). Eye diameter was measured as shown in the upper right. At least 30 eyes were scored for each genotype. Error bars are standard errors. The bottom panel shows the effects of the heterozygous Nipped-B and Rad21 mutations on the four scutellar macrochaete (large bristles). The number of flies scored for bristles is given above the bars.
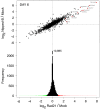
Figure 7. Genome-wide effects of Rad21 and Nipped-B RNAi on RNA transcripts in BG3 cells.
The top graph shows the effects of Rad21 knockdown on transcript levels (log2 Rad21/Mock) versus the effects of Nipped-B knockdown (log2 Nipped-B/Mock), 6 days after RNAi for all 18,770 probes on the microarray. E(spl)-C and invected-engrailed transcripts are red. The bottom is an aligned histogram of the effects of Rad21 RNAi, with transcripts that increase 2-fold or more in expression in red, and transcripts that decrease 2-fold or more in green.
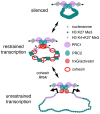
Figure 8. Speculative model for regulation of gene complexes by cohesin.
The top depicts a PcG-silenced complex contained in a loop created by PRE-PRE interactions. There is little or no transcription, and we posit that the silenced chromatin diameter prevents encirclement by cohesin. The nucleosomes have trimethylation of histone H3 on lysine 27 (green). The middle diagram depicts a gene complex in which cohesin, trithorax group (trxG), transcriptional activators, and PcG proteins combine to create an intermediate chromatin structure with aspects of both silenced and active regions that permits modest transcription (angled arrows); nucleosomes near the transcription start sites also have trimethylation of histone H3 on lysine 4 (pink). Based on the biphasic effects of Nipped-B and cohesin knockdown on some E(spl)-C transcripts, we posit that when cohesin levels are reduced, the chromatin structure first becomes closer to the silenced state, decreasing transcription, and that the higher order structure associated with silencing is eventually lost, leading to unrestrained transcription (bottom).
Similar articles
- Cohesin, gene expression and development: lessons from Drosophila.
Dorsett D. Dorsett D. Chromosome Res. 2009;17(2):185-200. doi: 10.1007/s10577-009-9022-5. Chromosome Res. 2009. PMID: 19308700 Free PMC article. Review. - Functional links between Drosophila Nipped-B and cohesin in somatic and meiotic cells.
Gause M, Webber HA, Misulovin Z, Haller G, Rollins RA, Eissenberg JC, Bickel SE, Dorsett D. Gause M, et al. Chromosoma. 2008 Feb;117(1):51-66. doi: 10.1007/s00412-007-0125-5. Epub 2007 Oct 2. Chromosoma. 2008. PMID: 17909832 Free PMC article. - The Many Roles of Cohesin in Drosophila Gene Transcription.
Dorsett D. Dorsett D. Trends Genet. 2019 Jul;35(7):542-551. doi: 10.1016/j.tig.2019.04.002. Epub 2019 May 23. Trends Genet. 2019. PMID: 31130395 Free PMC article. Review. - Brca2, Pds5 and Wapl differentially control cohesin chromosome association and function.
Misulovin Z, Pherson M, Gause M, Dorsett D. Misulovin Z, et al. PLoS Genet. 2018 Feb 15;14(2):e1007225. doi: 10.1371/journal.pgen.1007225. eCollection 2018 Feb. PLoS Genet. 2018. PMID: 29447171 Free PMC article. - Association of cohesin and Nipped-B with transcriptionally active regions of the Drosophila melanogaster genome.
Misulovin Z, Schwartz YB, Li XY, Kahn TG, Gause M, MacArthur S, Fay JC, Eisen MB, Pirrotta V, Biggin MD, Dorsett D. Misulovin Z, et al. Chromosoma. 2008 Feb;117(1):89-102. doi: 10.1007/s00412-007-0129-1. Epub 2007 Oct 27. Chromosoma. 2008. PMID: 17965872 Free PMC article.
Cited by
- Diverse developmental disorders from the one ring: distinct molecular pathways underlie the cohesinopathies.
Horsfield JA, Print CG, Mönnich M. Horsfield JA, et al. Front Genet. 2012 Sep 12;3:171. doi: 10.3389/fgene.2012.00171. eCollection 2012. Front Genet. 2012. PMID: 22988450 Free PMC article. - Cyclin-dependent kinase 8 module expression profiling reveals requirement of mediator subunits 12 and 13 for transcription of Serpent-dependent innate immunity genes in Drosophila.
Kuuluvainen E, Hakala H, Havula E, Sahal Estimé M, Rämet M, Hietakangas V, Mäkelä TP. Kuuluvainen E, et al. J Biol Chem. 2014 Jun 6;289(23):16252-61. doi: 10.1074/jbc.M113.541904. Epub 2014 Apr 28. J Biol Chem. 2014. PMID: 24778181 Free PMC article. - Cohesin at active genes: a unifying theme for cohesin and gene expression from model organisms to humans.
Dorsett D, Merkenschlager M. Dorsett D, et al. Curr Opin Cell Biol. 2013 Jun;25(3):327-33. doi: 10.1016/j.ceb.2013.02.003. Epub 2013 Mar 1. Curr Opin Cell Biol. 2013. PMID: 23465542 Free PMC article. Review. - Cohesin: genomic insights into controlling gene transcription and development.
Dorsett D. Dorsett D. Curr Opin Genet Dev. 2011 Apr;21(2):199-206. doi: 10.1016/j.gde.2011.01.018. Epub 2011 Feb 14. Curr Opin Genet Dev. 2011. PMID: 21324671 Free PMC article. Review. - The maintenance of chromosome structure: positioning and functioning of SMC complexes.
Jeppsson K, Kanno T, Shirahige K, Sjögren C. Jeppsson K, et al. Nat Rev Mol Cell Biol. 2014 Sep;15(9):601-14. doi: 10.1038/nrm3857. Nat Rev Mol Cell Biol. 2014. PMID: 25145851 Review.
References
- Michaelis C, Ciosk R, Nasmyth K. Cohesins: chromosomal proteins that prevent premature separation of sister chromatids. Cell. 1997;91:35–45. - PubMed
- Peters JM, Tedeschi A, Schmitz J. The cohesin complex and its roles in chromosome biology. Genes Dev. 2008;22:3089–3114. - PubMed
- Haering CH, Farcas AM, Arumugam P, Metson J, Nasmyth K. The cohesin ring concatenates sister DNA molecules. Nature. 2008;454:297–301. - PubMed
- Ivanov D, Nasmyth K. A topological interaction between cohesin rings and a circular minichromosome. Cell. 2005;122:849–860. - PubMed
Publication types
MeSH terms
Substances
Grants and funding
- R01 GM055683-09/GM/NIGMS NIH HHS/United States
- R01 GM055683/GM/NIGMS NIH HHS/United States
- P01 HD052860-040003/HD/NICHD NIH HHS/United States
- T32 GM008802/GM/NIGMS NIH HHS/United States
- R01 HG000249/HG/NHGRI NIH HHS/United States
- P01 HD052683/HD/NICHD NIH HHS/United States
- R01 GM055683-10A2/GM/NIGMS NIH HHS/United States
- R01 HG00249/HG/NHGRI NIH HHS/United States
- P01 HD052860-030003/HD/NICHD NIH HHS/United States
- P01 HD052860/HD/NICHD NIH HHS/United States
LinkOut - more resources
Full Text Sources
Molecular Biology Databases


