Gene regulation and chromatin remodeling by IL-12 and type I IFN in programming for CD8 T cell effector function and memory - PubMed (original) (raw)
Gene regulation and chromatin remodeling by IL-12 and type I IFN in programming for CD8 T cell effector function and memory
Pujya Agarwal et al. J Immunol. 2009.
Abstract
A third signal that can be provided by IL-12 or type I IFN is required for differentiation of naive CD8 T cells responding to Ag and costimulation. The cytokines program development of function and memory within 3 days of initial stimulation, and we show here that programming involves regulation of a common set of approximately 355 genes including T-bet and eomesodermin. Much of the gene regulation program is initiated in response to Ag and costimulation within 24 h but is then extinguished unless a cytokine signal is available. Histone deacetylase inhibitors mimic the effects of IL-12 or type I IFN signaling, indicating that the cytokines relieve repression and allow continued gene expression by promoting increased histone acetylation. In support of this, increased association of acetylated histones with the promoter loci of granzyme B and eomesodermin is shown to occur in response to IL-12, IFN-alpha, or histone deacetylase inhibitors. Thus, IL-12 and IFN-alpha/beta enforce in common a complex gene regulation program that involves, at least in part, chromatin remodeling to allow sustained expression of a large number of genes critical for CD8 T cell function and memory.
Figures
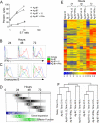
Figure 1. Programming of CD8 T cell differentiation requires IL-12 and/or IFNα along with Ag and costimulation
(A) Purified naïve (CD44lo) OT-1 CD8 T cells were stimulated for 3 days in vitro with aAPC coated with H-2Kb / Ova257-264 peptide and B7-1 either alone, or with IL-12 or IFNα. All cultures were supplemented with IL-2. Cytolytic activity was measured on day 3 by 51Cr release assay using E.G7 target cells. (B-C) Cells stimulated as in (A) were analyzed by intracellular staining on days 1, 2 and 3 for expression of IFNγ and grzB. (D) The upper bars (gray) show the numbers of genes regulated in common by IL-12 and IFNα at 24, 48 and 72h. The lower bars (colored) show the times during which Ag-B7 and IL-12 must be present for optimal clonal expansion and development of effector function (from ref. (16)). (E) Expression patterns for 408 probe ids representing the 375 genes regulated by both IL-12 and IFNα. The stimuli used and time in culture for each sample are shown at the top. Red represents high expression (signal value) and blue represents low expression on a log2 scale of 6.0 to 0.0 as shown at the bottom. Data not meeting the selection criterion was excluded and appears gray. The signal value was normalized to around 1. (F) Hierarchical clustering linkage for cells treated with the various stimuli at 0, 24, 48 and 72h.
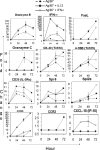
Figure 2. IL-12 and IFNα induce, enhance or sustain the expression of genes involved in effector functions
Time courses for expression of selected genes regulated by IL-12 and IFNα are shown. Expression is shown as the fold change in signal intensities upon stimulation with Ag-B7 alone ( ) or with IL-12 (ν) or IFNα (○) compared to the signal intensity for the gene in naïve cells (0 hr). (Note: different scales are used on y-axis for each gene, and scale breaks are included on the y-axis for IFNγ and CCR5).
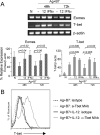
Figure 3. IL-12- and IFNα-dependent regulation of T-bet and eomesodermin mRNA expression
(A) Total RNA was isolated from naïve (CD44lo) OT-I CD8 T cells (0-h) or from purified OT-I CD8 T cells stimulated with Ag-B7 in presence of the indicated cytokines for 48 and 72h, and the mRNA expression level of T-bet and Eomes was determined by semi-quantitative RT-PCR. The linear range of amplification of transcripts was determined as described in Materials and Methods. The graphs represent mRNA quantification done by densitometry for three independent experiments. For each condition, the relative mRNA expression is shown as the mean ± S.D. Student's t-test was performed comparing IL-12 or IFNα with Ag-B7 alone and p-values are shown. (B) Naïve OT-I T cells were stimulated for 72hr with Ag-B7 alone or along with IL-12, as indicated, and the cells stained with anti-Tbet mAb or isotype control Ab and analyzed by flow cytometry.
Figure 4. Inhibition of histone deacetylation mimics signal 3 cytokine effects on CD8 T cell differentiation
Purified CD44lo OT-1 CD8 T cells were stimulated for 3 days with Ag-B7 coated aAPC alone or with IL-12, IFNα or trichostatin A (TSA) (7.5ng/ml). TSA was dissolved in DMSO, and controls having Ag-B7 and DMSO were included. (A-B) Expression of grzB and IFNγ by intracellular staining. Isotype controls were run for all samples (not shown), and gates set so that > 98% of events fell into the lower quadrant for the controls. (C) Cytolytic activity measured by 51Cr release assay using E.G7 target cells.
Figure 5. IL-12 and IFNα promote histone hyperacetylation at the grzB and Eomes gene loci during CD8 T cell differentiation
Purified CD44lo OT-I CD8 T cells were used as naïve control or were stimulated with Ag-B7 aAPC alone or with IL-12, IFNα or TSA (7.5ng/ml). Cells were harvested at 48h, processed, and examined by crosslinked-CHIP and qRT-PCR for acetylated histones H3 and H4. (A) Association of H3 and H4 histones with the grzB promoter, expressed as template copy numbers as a percent of whole genome copy number. Error bars show ranges for duplicate samples. (B-D) Association of H3 and H4 histones with the grzB promoter (B), grzB distal region (B) and the Eomes promoter (C) regions. Template copy numbers for each condition were internally normalized with their respective input control. Relative expression is calculated as the ratio of template copy numbers of each sample relative to the naïve control in each experiment, and is shown as mean with SEM of 2 or 3 independent experiments with duplicate samples for each. In comparison to naïve cells, activation with Ag-B7 resulted in significant increases of acetylated H3 and H4 histones with the promoter and exon regions of GrzB (p < 0.05), a significant decrease in acetylated H3 histone association with the Eomes promoter (p < 0.001), and no change in association of acetylated H4 with the Eomes promoter (p = 0.5). In comparison to cells stimulated with just Ag-B7, association of acetylated H3 and H4 histones was significantly greater when IL-12, IFNα or TSA was added (p < 0.03), with one exception. The exception was acetylated H4 association with the GrzB promoter, where the additions did not cause a significant increase (p > 0.05).
Similar articles
- Epigenetic remodeling of the IL-2 and IFN-gamma loci in memory CD8 T cells is influenced by CD4 T cells.
Northrop JK, Thomas RM, Wells AD, Shen H. Northrop JK, et al. J Immunol. 2006 Jul 15;177(2):1062-9. doi: 10.4049/jimmunol.177.2.1062. J Immunol. 2006. PMID: 16818762 - Programming for CD8 T cell memory development requires IL-12 or type I IFN.
Xiao Z, Casey KA, Jameson SC, Curtsinger JM, Mescher MF. Xiao Z, et al. J Immunol. 2009 Mar 1;182(5):2786-94. doi: 10.4049/jimmunol.0803484. J Immunol. 2009. PMID: 19234173 Free PMC article. - Signals required for programming effector and memory development by CD8+ T cells.
Mescher MF, Curtsinger JM, Agarwal P, Casey KA, Gerner M, Hammerbeck CD, Popescu F, Xiao Z. Mescher MF, et al. Immunol Rev. 2006 Jun;211:81-92. doi: 10.1111/j.0105-2896.2006.00382.x. Immunol Rev. 2006. PMID: 16824119 Review. - Inflammatory cytokines as a third signal for T cell activation.
Curtsinger JM, Mescher MF. Curtsinger JM, et al. Curr Opin Immunol. 2010 Jun;22(3):333-40. doi: 10.1016/j.coi.2010.02.013. Epub 2010 Apr 2. Curr Opin Immunol. 2010. PMID: 20363604 Free PMC article. Review.
Cited by
- Deciphering CD4+ T cell-mediated responses against cancer.
Kirkpatrick C, Lu YW. Kirkpatrick C, et al. Mol Carcinog. 2024 Jul;63(7):1209-1220. doi: 10.1002/mc.23730. Epub 2024 May 9. Mol Carcinog. 2024. PMID: 38725218 Review. - The potential and promise for clinical application of adoptive T cell therapy in cancer.
Li Y, Zheng Y, Liu T, Liao C, Shen G, He Z. Li Y, et al. J Transl Med. 2024 May 1;22(1):413. doi: 10.1186/s12967-024-05206-7. J Transl Med. 2024. PMID: 38693513 Free PMC article. Review. - A clinically attenuated double-mutant of porcine reproductive and respiratory syndrome virus-2 that does not prompt overexpression of proinflammatory cytokines during co-infection with a secondary pathogen.
Su CM, Kim J, Tang J, Hung YF, Zuckermann FA, Husmann R, Roady P, Kim J, Lee YM, Yoo D. Su CM, et al. PLoS Pathog. 2024 Mar 28;20(3):e1012128. doi: 10.1371/journal.ppat.1012128. eCollection 2024 Mar. PLoS Pathog. 2024. PMID: 38547254 Free PMC article. - mRNA Vaccine Nanoplatforms and Innate Immunity.
Wei L, Dong C, Zhu W, Wang BZ. Wei L, et al. Viruses. 2024 Jan 14;16(1):120. doi: 10.3390/v16010120. Viruses. 2024. PMID: 38257820 Free PMC article. Review. - The Role of CD4 T Cell Help in CD8 T Cell Differentiation and Function During Chronic Infection and Cancer.
Topchyan P, Lin S, Cui W. Topchyan P, et al. Immune Netw. 2023 Oct 23;23(5):e41. doi: 10.4110/in.2023.23.e41. eCollection 2023 Oct. Immune Netw. 2023. PMID: 37970230 Free PMC article. Review.
References
- Heath WR, Carbone FR. Cross-presentation, dendritic cells, tolerance and immunity. Annu. Rev. Immunol. 2001;19:47–64. - PubMed
- Aichele P, Unsoeld H, Koschella M, Schweier O, Kalinke U, Vucikuja S. CD8 T cells specific for lymphocytic choriomeningitis virus require type I IFN receptor for clonal expansion. J. Immunol. 2006;176:4525–4529. - PubMed
- Curtsinger JM, Schmidt CS, Mondino A, Lins DC, Kedl RM, Jenkins MK, Mescher MF. Inflammatory cytokines provide a third signal for activation of naive CD4+ and CD8+ T cells. J. Immunol. 1999;162:3256–3262. - PubMed
Publication types
MeSH terms
Substances
Grants and funding
- P01 AI35296/AI/NIAID NIH HHS/United States
- R01 GM054706-08/GM/NIGMS NIH HHS/United States
- R56 AI057484/AI/NIAID NIH HHS/United States
- R01 AI049494/AI/NIAID NIH HHS/United States
- P01 AI035296/AI/NIAID NIH HHS/United States
- P01 AI035296-15/AI/NIAID NIH HHS/United States
- R01 AI034824-09/AI/NIAID NIH HHS/United States
- R01 AI072068/AI/NIAID NIH HHS/United States
- R01 GM054706/GM/NIGMS NIH HHS/United States
- R01 AI34824/AI/NIAID NIH HHS/United States
- R01 GM54706/GM/NIGMS NIH HHS/United States
- R01 AI034824/AI/NIAID NIH HHS/United States
LinkOut - more resources
Full Text Sources
Other Literature Sources
Research Materials


