Structure and flexibility within proteins as identified through small angle X-ray scattering - PubMed (original) (raw)
Structure and flexibility within proteins as identified through small angle X-ray scattering
Martin Pelikan et al. Gen Physiol Biophys. 2009 Jun.
Abstract
Flexibility between domains of proteins is often critical for function. These motions and proteins with large scale flexibility in general are often not readily amenable to conventional structural analysis such as X-ray crystallography, nuclear magnetic resonance spectroscopy (NMR) or electron microscopy. A common evolution of a crystallography project, once a high resolution structure has been determined, is to postulate possible sights of flexibility. Here we describe an analysis tool using relatively inexpensive small angle X-ray scattering (SAXS) measurements to identify flexibility and validate a constructed minimal ensemble of models, which represent highly populated conformations in solution. The resolution of these results is sufficient to address the questions being asked: what kinds of conformations do the domains sample in solution? In our rigid body modeling strategy BILBOMD, molecular dynamics (MD) simulations are used to explore conformational space. A common strategy is to perform the MD simulation on the domains connections at very high temperature, where the additional kinetic energy prevents the molecule from becoming trapped in a local minimum. The MD simulations provide an ensemble of molecular models from which a SAXS curve is calculated and compared to the experimental curve. A genetic algorithm is used to identify the minimal ensemble (minimal ensemble search, MES) required to best fit the experimental data. We demonstrate the use of MES in several model and in four experimental examples.
Figures
Figure 1
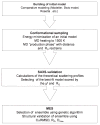
Schematic for BILBOMD strategy.
Figure 2
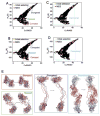
Application of MES to the artificial data sets. A.–D. Graphs represents the comparison of RG and Dmax values for all 15,000 S4 models (black) with their CαRMSD values referenced to the single model as selected in Fig. 3. Initially selected models and MES re-selected models are highlighted with yellow and pink dots, respectively. Area of selection for the data sets representing compact (red), relaxed (green), elongated (blue) and disordered conformers (cyan) are highlighted with boxes. E. Models of initially selected conformers (left models) are compared to those re-selected in MES (right models). Models representing compact (red), relaxed (green), elongated (blue) and disordered (cyan) data sets have been superimposed on each other with no principle axis restrain using program Supcomb (Kozin and Svergun 2001).
Figure 3
BILBOMD analysis of cellulosome scafoldin protein (S4). A. Graph represents the comparison of discrepancy (χ2) values for 15,000 S4 models with their RG values. The value for the best-fit model is indicated by red dot. The green dots indicate the five MES conformers which are shown in the panel C. B. Experimental SAXS curve (black). Red and green lines represent theoretical scattering for the best-fit and MES ensemble, respectively. Inset – calculated residuals (I(q)experiment/I(q)model) for MES ensemble with 5 conformers and single best-fit model. C. The best-fit model for S4 (left panel). The five MES-selected models superimposed on the cohesin from Clostridium thermocellum colored red, showing conformational space adopted by cohesion from Clostridium cellulolyticum colored in blue (right panel). D., E. Graphs represents the comparison of RG and Dmax values for all 15,000 models with their CαRMSD values referenced to the best-fit model. The values for the best-fit model and MES-selected models are indicated by red and green dots, respectively. F. χ2 values for MES fit in dependence to the number of selected conformers.
Figure 4
BILBOMD analysis of extracellular adherence protein (Eap). A. Graph represents the comparison of discrepancy (χ2) values for 15,000 Eap models with their RG values. The value for the best-fit model is indicated by red dot. The green dots indicate the five MES conformers. B. Experimental SAXS curve (black). Red and green lines represent theoretical scattering for the best-fit and MES ensemble, respectively. Inset – calculated residuals (I(q)experiment/I(q)model) for MES ensemble with 5 conformers and single best-fit model. C. The best-fit and five MES-selected model for Eap. The MES-selected models have been superimposed on each other with no principle axis restrain using program Supcomb (Kozin and Svergun 2001) (right panel). D., E. Graph represents the comparison of RG and Dmax values for all 15,000 models with their CαRMSD values referenced to the best-fit model. The values for the best-fit model and MES-selected models are indicated by red and green dots, respectively. F. χ2 values for MES fit in dependence to the number of selected conformers.
Figure 5
BILBOMD analysis of mammalian polynucleotide kinase (mPNK). A. Graph represents the comparison of discrepancy (χ2) values for 6000 mPNK models with their RG values. The value for best-fit model is indicated by red dot. The green dots indicate the five MES conformers. Inset – the superimposition of all 6000 nPNK modeled comnformers. FHA domains are shown in blue dot representation. PK is shown in carton colored (red). B. Experimental SAXS curve (black). Red and green lines represent theoretical scattering for the best-fit and MES ensemble, respectively. Inset – calculated residuals (I(q)experiment/I(q)model) for MES ensemble with 5 conformers and single best-fit model. For better visualization the residuals have been smoothed. C. The best-fit model for mPNK (left panel). The five MES-selected models, representing conformational space of the FHA domain (colored blue). The models are superimposed on the PK structure colored red (right panel). D., E. Graph represents the comparison of RG and Dmax values for all 6000 models with their CαRMSD values referenced to the best-fit model. The values for the best-fit model and MES-selected models are indicated by red and green dots, respectively. F. χ2 values for MES fit in dependence to the number of selected conformers.
Figure 6
BILBOMD analysis of Flavin reductase domain protein (FRDP). A. Graph represents the comparison of discrepancy (χ2) values for 7000 FRDP models with their RG values. The value for best-fit model is indicated by red dot. The green dots indicate the five MES conformers. B. Experimental SAXS curve (black). The theoretical scattering profile for FRDP atomic structure missing flexible N-terminal extension (pink line). Red and green lines represent the theoretical scattering for the best-fit and MES ensemble, respectively. Inset – calculated residuals (I(q)experiment/I(q)model) for MES ensemble with 5 conformers and single best-fit model. C. The best-fit model for FRDP (left panel). The five MES-selected models (right panel). D., E. Graph represents the comparison of RG and Dmax values for all 7000 models with their CαRMSD values referenced to the best-fit model. The values for the best-fit model and MES-selected models are indicated by red and green dots, respectively. F. χ2 values for MES fit in dependence to the number of selected conformers.
Similar articles
- Characterization of protein flexibility using small-angle x-ray scattering and amplified collective motion simulations.
Wen B, Peng J, Zuo X, Gong Q, Zhang Z. Wen B, et al. Biophys J. 2014 Aug 19;107(4):956-64. doi: 10.1016/j.bpj.2014.07.005. Biophys J. 2014. PMID: 25140431 Free PMC article. - Hybrid Methods for Modeling Protein Structures Using Molecular Dynamics Simulations and Small-Angle X-Ray Scattering Data.
Ekimoto T, Ikeguchi M. Ekimoto T, et al. Adv Exp Med Biol. 2018;1105:237-258. doi: 10.1007/978-981-13-2200-6_15. Adv Exp Med Biol. 2018. PMID: 30617833 Review. - Molecular Dynamics Simulations Combined with Nuclear Magnetic Resonance and/or Small-Angle X-ray Scattering Data for Characterizing Intrinsically Disordered Protein Conformational Ensembles.
Chan-Yao-Chong M, Durand D, Ha-Duong T. Chan-Yao-Chong M, et al. J Chem Inf Model. 2019 May 28;59(5):1743-1758. doi: 10.1021/acs.jcim.8b00928. Epub 2019 Mar 18. J Chem Inf Model. 2019. PMID: 30840442 Review. - Validation of macromolecular flexibility in solution by small-angle X-ray scattering (SAXS).
Hammel M. Hammel M. Eur Biophys J. 2012 Oct;41(10):789-99. doi: 10.1007/s00249-012-0820-x. Epub 2012 May 26. Eur Biophys J. 2012. PMID: 22639100 Free PMC article. Review. - Structural analysis of intrinsically disordered proteins by small-angle X-ray scattering.
Bernadó P, Svergun DI. Bernadó P, et al. Mol Biosyst. 2012 Jan;8(1):151-67. doi: 10.1039/c1mb05275f. Epub 2011 Sep 22. Mol Biosyst. 2012. PMID: 21947276 Review.
Cited by
- Sample preparation, data collection, and preliminary data analysis in biomolecular solution X-ray scattering.
Grishaev A. Grishaev A. Curr Protoc Protein Sci. 2012 Nov;Chapter 17:17.14.1-17.14.18. doi: 10.1002/0471140864.ps1714s70. Curr Protoc Protein Sci. 2012. PMID: 23151743 Free PMC article. - Structural analysis of a new carotenoid-binding protein: the C-terminal domain homolog of the OCP.
Dominguez-Martin MA, Hammel M, Gupta S, Lechno-Yossef S, Sutter M, Rosenberg DJ, Chen Y, Petzold CJ, Ralston CY, Polívka T, Kerfeld CA. Dominguez-Martin MA, et al. Sci Rep. 2020 Sep 23;10(1):15564. doi: 10.1038/s41598-020-72383-y. Sci Rep. 2020. PMID: 32968135 Free PMC article. - Defining NADH-Driven Allostery Regulating Apoptosis-Inducing Factor.
Brosey CA, Ho C, Long WZ, Singh S, Burnett K, Hura GL, Nix JC, Bowman GR, Ellenberger T, Tainer JA. Brosey CA, et al. Structure. 2016 Dec 6;24(12):2067-2079. doi: 10.1016/j.str.2016.09.012. Epub 2016 Nov 3. Structure. 2016. PMID: 27818101 Free PMC article. - Structural dynamics and single-stranded DNA binding activity of the three N-terminal domains of the large subunit of replication protein A from small angle X-ray scattering.
Pretto DI, Tsutakawa S, Brosey CA, Castillo A, Chagot ME, Smith JA, Tainer JA, Chazin WJ. Pretto DI, et al. Biochemistry. 2010 Apr 6;49(13):2880-9. doi: 10.1021/bi9019934. Biochemistry. 2010. PMID: 20184389 Free PMC article. - Combined Solution and Crystal Methods Reveal the Electrostatic Tethers That Provide a Flexible Platform for Replication Activities in the Bacteriophage T7 Replisome.
Foster BM, Rosenberg D, Salvo H, Stephens KL, Bintz BJ, Hammel M, Ellenberger T, Gainey MD, Wallen JR. Foster BM, et al. Biochemistry. 2019 Nov 12;58(45):4466-4479. doi: 10.1021/acs.biochem.9b00525. Epub 2019 Nov 4. Biochemistry. 2019. PMID: 31659895 Free PMC article.
References
- Aslam M, Guthridge JM, Hack BK, Quigg RJ, Holers VM, Perkins SJ. The extended multidomain solution structures of the complement protein Crry and its chimeric conjugate Crry-Ig by scattering, analytical ultracentrifugation and constrained modelling: implications for function and therapy. J Mol Biol. 2003;329:525–550. doi: 10.1016/S0022-2836(03)00492-3. - DOI - PubMed
Publication types
MeSH terms
Substances
LinkOut - more resources
Full Text Sources
Miscellaneous


