Droplet microfluidic technology for single-cell high-throughput screening - PubMed (original) (raw)
Droplet microfluidic technology for single-cell high-throughput screening
Eric Brouzes et al. Proc Natl Acad Sci U S A. 2009.
Abstract
We present a droplet-based microfluidic technology that enables high-throughput screening of single mammalian cells. This integrated platform allows for the encapsulation of single cells and reagents in independent aqueous microdroplets (1 pL to 10 nL volumes) dispersed in an immiscible carrier oil and enables the digital manipulation of these reactors at a very high-throughput. Here, we validate a full droplet screening workflow by conducting a droplet-based cytotoxicity screen. To perform this screen, we first developed a droplet viability assay that permits the quantitative scoring of cell viability and growth within intact droplets. Next, we demonstrated the high viability of encapsulated human monocytic U937 cells over a period of 4 days. Finally, we developed an optically-coded droplet library enabling the identification of the droplets composition during the assay read-out. Using the integrated droplet technology, we screened a drug library for its cytotoxic effect against U937 cells. Taken together our droplet microfluidic platform is modular, robust, uses no moving parts, and has a wide range of potential applications including high-throughput single-cell analyses, combinatorial screening, and facilitating small sample analyses.
Conflict of interest statement
The authors declare no conflict of interest.
Figures
Fig. 1.
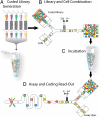
Droplet screening workflow. The droplet screen has 4 steps. (A) A reformatting step to emulsify compound-code pairs and pool them into a droplet library. (B) Merging each library member with one of the cell-containing droplets that are continuously generated. Hence, each cell droplet has a specific composition defined by the compound droplet it has merged with. (C) Incubation. (D) Merged droplets are reinjected into an assay chip to identify each compound via their code and assess their specific effect on cells.
Fig. 2.
Development of an on-chip viability assay. The viability assay chip integrated a series of 5 modules that had been optimized for analysis of cell viability. These modules sequentially manipulated droplets to conduct a viability assay on a single chip. (A) A set of 2 nozzles encapsulated cells and live/dead fluorescent dyes respectively. The fork enabled the interdigitation of the streams resulting in cell-containing droplets alternating with dye-containing droplets (100 μm deep channels). (B) A fusion module that delivered an AC field permitted electrically-controlled merging of pairs of dye-containing droplets and cell-containing droplets (100 μm deep). (C) A mixing module facilitated rapid and thorough mixing of cells with dyes (100 μm deep). (D) A delay line optimized cell staining by enabling on-chip incubation of the droplet for 15 min (260 μm deep). (E) A detection module confined droplet laterally and vertically to collect the fluorescent signals excited with a laser slit (100 μm deep). Live cells and dead cells were scored with Calcein-AM and Sytox Orange, respectively.
Fig. 3.
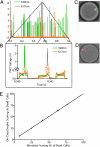
On-chip viability assay characterization. Monocytic U937 cells were encapsulated and tested for their cell state with the integrated viability assay chip. (A) Typical 1 second raw signal trace collected by the photomultipliers. (B) A close-up of this raw trace showed typical droplet signals. The droplet fluorescence signature was characterized by an approximately rectangular cross-section. Peak signals corresponding to cell staining were characterized by higher maximum signal and narrower full-width at half-maximum. Each cell stain could be clearly distinguished on top of the homogeneous signal. In this trace, we could see 3 droplets, containing a live cell (520 nm), a dead cell (617 nm), and no cell, respectively. (C and D) Images of a live cell and of a dead cell inside droplets. (E) Assay performance characterization. Different mixtures of live and dead cells were scored, and the results were compared with control reactions performed in a microtiter assay. The results showed a strong correlation between the 2 methods.
Fig. 4.
Quantitative in-droplet cell growth and survival. The integrated viability assay was used to optimize cell encapsulation and storage conditions to achieve maximum survival of encapsulated cells. Human monocytic U937 cells were encapsulated inside droplets, collected into a glass syringe, and incubated in a standard cell incubator. (A) After different incubation times, the encapsulated cells were assayed for viability using the integrated viability chip. Encapsulated cells maintained >80% survival up to 4 days post-encapsulation. (B) To assess the balance between cell growth and cell death, we analyzed the distribution of the total number of cells per droplet over time. During the first 24 h, the distribution of number of cells contained in each droplet showed a partial shift toward droplets containing more cells, the distribution remained very constant after this initial period. The results show that only limited cell growth occurred during the first 24 hours.
Fig. 5.
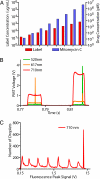
Drug library coding and decoding. We used the integrated viability assay to screen an optically encoded mitomycin C drug library for its cytotoxic effect against human monocytic U937 cells. (A) Each drug concentration was coded with a specific concentration of a dye fluorescent at 710 nm (Alexa Fluor 680 R-phycoerythrin). The resulting 8-member library contained the mitomycin C drug diluted 6-fold stepwise (4 μM for the highest concentration) and the coding dye diluted 2-fold stepwise (1.8 mg/mL for the highest concentration). (B) The coding signal is collected in the third detection channel (710 nm), in addition to the signal traces of the viability stained cells in the first 2 detection channels (520 nm; 617 nm) (compare to Fig. 3_B_). (C) The histogram clearly shows that the 8 members of the library are optically resolved during the read-out after the 2 merges during the experiment. Each condition tested roughly equal numbers of cells (≈900 cells corresponding to ≈900 droplets per condition). The signal of the highest concentration member was clipped because of PMT saturation.
Fig. 6.
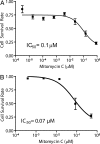
Mitomycin C cytotoxicity characterization. As a screening proof-of-principle, we generated a dose-response curve of the effect of mitomycin C on U937 in cells. (A) By binning each library member based on its coding signal, we could assess the specific effect of each compound concentration. (B) Control dose-response curve in a microtiter plate assay. The dose-response curve generated on-chip and the IC50 inferred were similar to microtiter plate controls. Both the shape and the IC50 were similar to the on-chip screen results. The main difference resided in the ∼15% loss of cell viability during cell encapsulation, which resulted in a slightly compressed assay dynamic range when this initial cell death was not subtracted.
Similar articles
- Development of Droplet Microfluidics Enabling High-Throughput Single-Cell Analysis.
Wen N, Zhao Z, Fan B, Chen D, Men D, Wang J, Chen J. Wen N, et al. Molecules. 2016 Jul 5;21(7):881. doi: 10.3390/molecules21070881. Molecules. 2016. PMID: 27399651 Free PMC article. Review. - Printed droplet microfluidics for on demand dispensing of picoliter droplets and cells.
Cole RH, Tang SY, Siltanen CA, Shahi P, Zhang JQ, Poust S, Gartner ZJ, Abate AR. Cole RH, et al. Proc Natl Acad Sci U S A. 2017 Aug 15;114(33):8728-8733. doi: 10.1073/pnas.1704020114. Epub 2017 Jul 31. Proc Natl Acad Sci U S A. 2017. PMID: 28760972 Free PMC article. - High-throughput microfluidic droplets in biomolecular analytical system: A review.
Zhang L, Parvin R, Chen M, Hu D, Fan Q, Ye F. Zhang L, et al. Biosens Bioelectron. 2023 May 15;228:115213. doi: 10.1016/j.bios.2023.115213. Epub 2023 Mar 8. Biosens Bioelectron. 2023. PMID: 36906989 Review. - Dendronized fluorosurfactant for highly stable water-in-fluorinated oil emulsions with minimal inter-droplet transfer of small molecules.
Chowdhury MS, Zheng W, Kumari S, Heyman J, Zhang X, Dey P, Weitz DA, Haag R. Chowdhury MS, et al. Nat Commun. 2019 Oct 4;10(1):4546. doi: 10.1038/s41467-019-12462-5. Nat Commun. 2019. PMID: 31586046 Free PMC article. - An ultra high-efficiency droplet microfluidics platform using automatically synchronized droplet pairing and merging.
Zhang H, Guzman AR, Wippold JA, Li Y, Dai J, Huang C, Han A. Zhang H, et al. Lab Chip. 2020 Nov 7;20(21):3948-3959. doi: 10.1039/d0lc00757a. Epub 2020 Sep 16. Lab Chip. 2020. PMID: 32935710
Cited by
- Single-cell analysis and sorting using droplet-based microfluidics.
Mazutis L, Gilbert J, Ung WL, Weitz DA, Griffiths AD, Heyman JA. Mazutis L, et al. Nat Protoc. 2013 May;8(5):870-91. doi: 10.1038/nprot.2013.046. Epub 2013 Apr 4. Nat Protoc. 2013. PMID: 23558786 Free PMC article. - Single-Cell Sequencing of T cell Receptors: A Perspective on the Technological Development and Translational Application.
Gupta S, Witas R, Voigt A, Semenova T, Nguyen CQ. Gupta S, et al. Adv Exp Med Biol. 2020;1255:29-50. doi: 10.1007/978-981-15-4494-1_3. Adv Exp Med Biol. 2020. PMID: 32949388 Free PMC article. Review. - Evaluation of second-generation sequencing of 19 dilated cardiomyopathy genes for clinical applications.
Gowrisankar S, Lerner-Ellis JP, Cox S, White ET, Manion M, LeVan K, Liu J, Farwell LM, Iartchouk O, Rehm HL, Funke BH. Gowrisankar S, et al. J Mol Diagn. 2010 Nov;12(6):818-27. doi: 10.2353/jmoldx.2010.100014. Epub 2010 Sep 23. J Mol Diagn. 2010. PMID: 20864638 Free PMC article. - Comparative cytocompatibility of multiple candidate cell types to photoencapsulation in PEGNB/PEGDA macroscale or microscale hydrogels.
Jiang Z, Jiang K, McBride R, Oakey JS. Jiang Z, et al. Biomed Mater. 2018 Oct 2;13(6):065012. doi: 10.1088/1748-605X/aadf9a. Biomed Mater. 2018. PMID: 30191888 Free PMC article. - Droplet Microfluidics-Enabled High-Throughput Screening for Protein Engineering.
Weng L, Spoonamore JE. Weng L, et al. Micromachines (Basel). 2019 Oct 29;10(11):734. doi: 10.3390/mi10110734. Micromachines (Basel). 2019. PMID: 31671786 Free PMC article. Review.
References
- Unger MA, et al. Monolithic microfabricated valves and pumps by multilayer soft lithography. Science. 2000;288:113–116. - PubMed
- Clausell-Tormos J, et al. Droplet-based microfluidic platforms for the encapsulation and screening of Mammalian cells and multicellular organisms. Chem Biol. 2008;15:427–437. - PubMed
- He M, et al. Selective encapsulation of single cells and subcellular organelles into picoliter- and femtoliter-volume droplets. Anal Chem. 2005;77:1539–1544. - PubMed
- Huebner A, et al. Quantitative detection of protein expression in single cells using droplet microfluidics. Chem Commun. 2007;12:1218–1220. - PubMed
Publication types
MeSH terms
Substances
LinkOut - more resources
Full Text Sources
Other Literature Sources
Molecular Biology Databases


