Knockdown of brain-derived neurotrophic factor in specific brain sites precipitates behaviors associated with depression and reduces neurogenesis - PubMed (original) (raw)
Knockdown of brain-derived neurotrophic factor in specific brain sites precipitates behaviors associated with depression and reduces neurogenesis
D Taliaz et al. Mol Psychiatry. 2010 Jan.
Abstract
Depression has been associated with reduced expression of brain-derived neurotrophic factor (BDNF) in the hippocampus. In addition, animal studies suggest an association between reduced hippocampal neurogenesis and depressive-like behavior. These associations were predominantly established based on responses to antidepressant drugs and alterations in BDNF levels and neurogenesis in depressive patients or animal models for depressive behavior. Nevertheless, there is no direct evidence that the actual reduction of the BDNF protein in specific brain sites can induce depressive-like behaviors or affect neurogenesis in vivo. Using BDNF knockdown by RNA interference and lentiviral vectors injected into specific subregions of the hippocampus we show that a reduction in BDNF expression in the dentate gyrus, but not the CA3, reduces neurogenesis and affects behaviors associated with depression. Moreover, we show that BDNF has a critical function in neuronal differentiation, but not proliferation in vivo. Finally, we found that a specific BDNF knockdown in the ventral subiculum induces anhedonic-like behavior. These findings provide substantial support for the neurotrophic hypothesis of depression and specify anatomical and neurochemical targets for potential antidepressant interventions. Moreover, the specific effect of BDNF reduction on neuronal differentiation has broader implications for the study of neurodevelopment and neurodegenerative diseases.
Figures
Figure 1
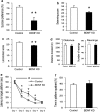
Validation of LV-shBDNF infection and brain-derived neurotrophic factor (BDNF) knockdown (KD) in vitro and in vivo. BDNF protein expression was measured in a C6 rat glioma cell line and in vivo in response to infection with lentiviral vector (LV) expressing either green fluorescent protein (GFP) only (LV-GFP; infection control), scrambled shRNA (LV-shSCR; shRNA control) or shRNA complementary to the coding axon of the rat BDNF gene (LV-shBDNF; active sequence). Panel a presents BDNF levels measured in a C6 cell medium 48 h after infection and normalized per 106 cell number. Data are presented as percentages of BDNF secreted from noninfected control cells. One-way analysis of variance (ANOVA) reveals a significant main effect of treatment (F(3, 20)=374.756, P<0.001). Differences between the various LV treatments were assessed using Fisher post hoc analysis (***P<0.001; _n_=6 per treatment). Panel b presents BDNF levels in the dentate gyrus (DG) measured by immunohistochemistry and epifluorescence microscopy. The intensity per unit area was measured for each slice. BDNF levels are expressed as a percentage of control, by measuring the intensity in slices taken from infected rats relative to control slices taken from the noninfected rats. One-way ANOVA revealed a significant main effect of treatment (F(3, 17)=29.926, P<0.01). Differences between control and infected brains were assessed using Fisher post hoc analysis (**P<0.01; _n_=5 to 6 per group). Panel c presents BDNF levels in the dDG measured by ELISA and normalized per total protein. BDNF levels are expressed as a percentage of control. One-way ANOVA revealed a significant main effect of treatment (F(3, 14)=5.868, P<0.01). Differences between control and infected brains were assessed using Fisher post hoc analysis (**P<0.01; _n_=4 or 5 per group). Panel d presents representative micrographs of hippocampal slices including the dDG from the rats injected with LV-shSCR (control) or LV-shBDNF (BDNF KD). The micrographs in the left present the infection spread based on the GFP expression (green) within the sections. BDNF protein expression was visualized by immunohistochemical staining (middle lane). Note the significant reduction in BDNF expression induced by the LV-shBDNF microinjection. Cell nuclei were visualized using Hoechst staining (lower lane). The micrographs on the right show a higher magnification of an infected hippocampal region. The upper lane shows GFP expression as an infection marker, whereas the middle lane shows BDNF protein staining. The lower lane shows superimposition of the upper and middle lanes to highlight cells expressing both GFP and BDNF. The arrows highlight that while the rat brain infected with LV-shSCR show BDNF expression within infected (GFP) cells, none of the infected cells in the LV-shBDNF rat brain show BDNF expression. Scale bar=200 μm at the left micrographs and 20 μm at the right micrographs.
Figure 2
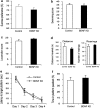
Behavioral analysis of rats subjected to brain-derived neurotrophic factor (BDNF) knockdown (KD) in the dorsal dentate gyrus (dDG). Lentiviral vector (LV)-shBDNF (knockdown) or LV-shSCR (control) constructs were injected into the dDG of mature rats. The battery of behavioral tests was initiated 3 weeks after recovery from the surgery and the following parameters were measured: sucrose preference (a), activity in a modified forced swim test (FST) (b), home-cage locomotion (c), exploration of a novel environment (d), latency to reach the platform in the water maze task (e) and percent of time spent at the target quadrant during the probe trial in the water maze task (f). Sucrose preference was assessed over a 10-day period using a 0.2% sucrose solution (t(43)=3.526, _P_=0.01). A modified FST was videotaped, and activity was scored and analyzed using our locally developed software which involves a computer attached joystick35 (t(38)=2.183, P<0.05). Locomotion was automatically measured over four consecutive nights in the home cage of rats (_t_(41)=2.855, _P_<0.01). The total distance traveled and number of rearings were automatically quantified in the test for exploration in a novel environment. The water maze task consisted of five training sessions over 5 days, and a test day 3 days later. A two-way repeated measures analysis of variance (ANOVA) revealed a significant Group X session interaction (_F_(1,26)=4.835, _P_<0.05). In the water maze task, the latency to find the platform was significantly lower in control rats than in BDNF KD rats at days 2, 3 and 4 (_t_(26)>2.115, P<0.05) but not at days 1 and 5. The probe trial was conducted 3 days after the training sessions, and the percentage of time spent at the target quadrant was measured during a 1-min test. The level of a random distribution between quadrants was 25%. Values are mean±s.e.m. (_n_=20 to 23 per group for all tests except for the water maze in which _n_=14 per group; *P<0.05, **_P_≤0.01).
Figure 3
Behavioral analysis of rats subjected to brain-derived neurotrophic factor (BDNF) knockdown (KD) in the CA3. Lentiviral vector (LV)-shBDNF (knockdown) or LV-shSCR (control) constructs were injected into the CA3 of mature rats. The battery of behavioral tests was initiated 3 weeks after recovery from the surgery and the following parameters were measured: sucrose preference (a), activity in a modified forced swim test (FST) (b), home-cage locomotion (c), exploration of a novel environment (d), latency to reach the platform in the water maze task (e) and percent of time spent at the target quadrant during the probe trial in the water maze task (f), as described in Figure 2. Values are mean±s.e.m. (_n_=8 per group).
Figure 4
The behavioral effect of brain-derived neurotrophic factor (BDNF) knockdown in the ventral subiculum (vSUB). Lentiviral vector (LV)-shBDNF (knockdown) or LV-shSCR (control) constructs were injected into the vSUB of mature rats. The battery of behavioral tests was initiated 3 weeks after recovery from the surgery and the following parameters were measured: sucrose preference (a), activity in a modified forced swim test (FST) (b), home-cage locomotion (c), exploration of a novel environment (d), latency to reach the platform in the water maze task (e) and percent of time spent at the target quadrant during the probe trial in the water maze task (f), as described in Figure 2. Values are mean±s.e.m. (* P<0.05, _n_=11 per group). A significant difference between the experimental groups was observed only in the sucrose preference test (t(20)=2.418, P<0.05).
Figure 5
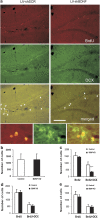
The effect of brain-derived neurotrophic factor (BDNF) knockdown on hippocampal neurogenesis. Neurogenesis in the subgranular zone (SGZ) was measured 2 months after the induction of BDNF knockdown (KD) in the dorsal dentate gyrus (dDG), CA3 or ventral subiculum (vSUB) of mature rats. Rats were injected intraperitoneally with 50 mg kg−1 bromodeoxyuridine (BrdU) at 12 h intervals for 2 days. Twenty-four hours or a week later rats were deeply anesthetized and transcardially perfused. Immunohistochemistry was performed to detect neuronal dividing cells by counting the cells that incorporated BrdU into their genome, and express the immature neuronal marker doublecortin X (DCX), as shown in the small micrographs. Representative micrographs of the dDG from rats injected with lentiviral vector (LV)-shSCR (Control) or LV-shBDNF (BDNF KD) into their dDG are presented in panel a. Proliferation was measured by counting BrdU-stained cells (upper lane), immature neurons were visualized by DCX (middle lane), and differentiation was measured by counting double-labeled BrdU and DCX cells (lower lane). Scale bar=200 μm. Panel b shows a quantitative analysis of proliferation comparing control and BDNF KD rats after LV infections in the dDG. This panel presents data from rats that were euthanized 24 h after BrdU injections. Panels c,d and e show a quantitative analysis of proliferation and differentiation comparing control and BDNF KD rats after LV infections in the dDG, CA3 or vSUB, respectively. These rats were injected with BrdU a week before euthanasia. A significant effect of BDNF KD was observed only in the dDG group and only in the number of differentiated neuronal cells (BrdU + DCX) (t(11)=5.672, P<0.001), but not in total proliferation (BrdU). Values are mean±s.e.m. (*** P<0.001, _n_=6–9 per group).
Similar articles
- Antidepressant and neuroprotective effect of the Chinese herb kaixinsan against lentiviral shRNA knockdown brain-derived neurotrophic factor-induced injury in vitro and in vivo.
Hu Y, Zhou XJ, Liu P, Dong XZ, Mu LH, Chen YB, Liu MY, Yu BY. Hu Y, et al. Neuropsychobiology. 2014;69(3):129-39. doi: 10.1159/000358089. Epub 2014 Apr 26. Neuropsychobiology. 2014. PMID: 24776773 - Regulation of brain-derived neurotrophic factor (BDNF) in the chronic unpredictable stress rat model and the effects of chronic antidepressant treatment.
Larsen MH, Mikkelsen JD, Hay-Schmidt A, Sandi C. Larsen MH, et al. J Psychiatr Res. 2010 Oct;44(13):808-16. doi: 10.1016/j.jpsychires.2010.01.005. Epub 2010 Feb 20. J Psychiatr Res. 2010. PMID: 20172535 - Site-specific antidepressant effects of repeated subconvulsive electrical stimulation: potential role of brain-derived neurotrophic factor.
Gersner R, Toth E, Isserles M, Zangen A. Gersner R, et al. Biol Psychiatry. 2010 Jan 15;67(2):125-32. doi: 10.1016/j.biopsych.2009.09.015. Biol Psychiatry. 2010. PMID: 19880094 - Neuropeptides in depression: role of VGF.
Thakker-Varia S, Alder J. Thakker-Varia S, et al. Behav Brain Res. 2009 Feb 11;197(2):262-78. doi: 10.1016/j.bbr.2008.10.006. Epub 2008 Oct 15. Behav Brain Res. 2009. PMID: 18983874 Free PMC article. Review. - The hippocampus, neurotrophic factors and depression: possible implications for the pharmacotherapy of depression.
Masi G, Brovedani P. Masi G, et al. CNS Drugs. 2011 Nov 1;25(11):913-31. doi: 10.2165/11595900-000000000-00000. CNS Drugs. 2011. PMID: 22054117 Review.
Cited by
- Long-Term Oral Tamoxifen Administration Decreases Brain-Derived Neurotrophic Factor in the Hippocampus of Female Long-Evans Rats.
Been LE, Halliday AR, Blossom SM, Bien EM, Bernhard AG, Roth GE, Domenech Rosario KI, Pollock KB, Abramenko PE, Behbehani LM, Pascal GJ, Kelly ME. Been LE, et al. Cancers (Basel). 2024 Mar 31;16(7):1373. doi: 10.3390/cancers16071373. Cancers (Basel). 2024. PMID: 38611051 Free PMC article. - Esketamine Prevents Postoperative Emotional and Cognitive Dysfunction by Suppressing Microglial M1 Polarization and Regulating the BDNF-TrkB Pathway in Ageing Rats with Preoperative Sleep Disturbance.
Wen Y, Xu J, Shen J, Tang Z, Li S, Zhang Q, Li J, Sun J. Wen Y, et al. Mol Neurobiol. 2024 Aug;61(8):5680-5698. doi: 10.1007/s12035-023-03860-4. Epub 2024 Jan 15. Mol Neurobiol. 2024. PMID: 38221533 Free PMC article. - Sigma-1 receptor activation mediates the sustained antidepressant effect of ketamine in mice via increasing BDNF levels.
Ma H, Li JF, Qiao X, Zhang Y, Hou XJ, Chang HX, Chen HL, Zhang Y, Li YF. Ma H, et al. Acta Pharmacol Sin. 2024 Apr;45(4):704-713. doi: 10.1038/s41401-023-01201-8. Epub 2023 Dec 14. Acta Pharmacol Sin. 2024. PMID: 38097715
References
- Karege F, Vaudan G, Schwald M, Perroud N, La Harpe R. Neurotrophin levels in postmortem brains of suicide victims the effects of antemortem diagnosis psychotropic drugs. Brain Res. 2005;136:29–37. - PubMed
- Dwivedi Y, Rizavi HS, Conley RR, Roberts RC, Tamminga CA, Pandey GN. Altered gene expression of brain-derived neurotrophic factor receptor tyrosine kinase B in postmortem brain of suicide subjects. Arch Gen Psychiatry. 2003;60:804–815. - PubMed
- Santarelli L, Saxe M, Gross C, Surget A, Battaglia F, Dulawa S, et al. Requirement of hippocampal neurogenesis for the behavioral effects of antidepressants. Science (New York, NY) 2003;301:805–809. - PubMed
Publication types
MeSH terms
Substances
LinkOut - more resources
Full Text Sources
Other Literature Sources
Medical
Miscellaneous


