Bcl6 mediates the development of T follicular helper cells - PubMed (original) (raw)
Bcl6 mediates the development of T follicular helper cells
Roza I Nurieva et al. Science. 2009.
Abstract
A fundamental function of CD4+ helper T (T(H)) cells is the regulation of B cell-mediated humoral immunity. Development of T follicular helper (T(FH)) cells that provide help to B cells is mediated by the cytokines interleukin-6 and interleukin-21 but is independent of TH1, TH2, and TH17 effector cell lineages. Here, we characterize the function of Bcl6, a transcription factor selectively expressed in T(FH) cells. Bcl6 expression is regulated by interleukin-6 and interleukin-21. Bcl6 overexpression induced T(FH)-related gene expression and inhibited other T(H) lineage cell differentiation in a DNA binding-dependent manner. Moreover, Bcl6 deficiency in T cells resulted in impaired T(FH) cell development and germinal center reactions, and altered production of other effector T cell subsets. Our data thus illustrate that Bcl6 is required for programming of T(FH) cell generation.
Figures
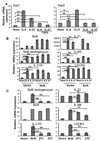
Fig. 1
Bcl6 regulates TFH-specific gene expression. (A) Naïve T cells were activated with antibodies to CD3 and CD28, and with or without indicated cytokines for 1 or 2 days. Bcl6 mRNA expression was analyzed by real-time RT-PCR. The graph shows means ± SD. *P < 0.005; **P < 0.001 when comparing IL-6 and IL-6 plus TGFβ to nontreated sample, analysis of variance (ANOVA) test. ++P < 0.001 when comparing IL-21 and IL-21 plus TGFβ to nontreated sample, ANOVA test. (B) Naïve OT-II T cells were activated with antibodies to CD3 and CD28 alone or together with IL-6 or IL-21 and with antibodies to IL-4, IFNγ, and TGFβ, and infected with a bicistronic retrovirus containing internal ribosomal entry site green fluorescent protein (GFP) expressing Bcl6 or a vector control virus. mRNA expression of indicated genes was assessed by real-time RT-PCR. (C) Naïve OT-II T cells were activated with antibodies to CD3 and CD28 alone and infected with retroviruses expressing Bcl6, Bcl6 mutants (ZF3 and ZF5), or vector alone. GFP+ cells were sorted from (B) and (C) and restimulated for 4 hours with antibody to CD3. mRNA expression of indicated genes was analyzed by real-time RT-PCR. The data shown were normalized to the expression of a reference gene, Actb. The graph shows means ± SD. *P < 0.005; **P < 0.001, t test. The data represent at least three independent experiments with consistent results.
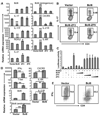
Fig. 2
Bcl6 suppresses TH17 and TH1 differentiation. (A and B) Naïve OT-II T cells were activated under TH17 conditions and infected with retroviruses expressing Bcl6, Bcl6 mutants, or vector alone. GFP+ cells sorted by fluorescence-activated cell sorting (FACS) were restimulated with antibody to CD3, and mRNA expression of indicated genes was analyzed by real-time RT-PCR (A). The data shown were normalized to the expression of reference gene Actb. The graph shows means ± SD. *P < 0.005; **P < 0.001 when comparing Bcl6 and ZF3 to vector alone, ANOVA test. ++P < 0.001 when comparing Bcl6 and ZF5 to vector alone, ANOVA test. IL-17–expressing cells were measured by intracellular staining of the sorted GFP+ population (B). Numbers in dot-plot quadrants represent the percentages. (C) EL-4 cells were transfected with a vector containing the firefly luciferase gene under the control of the IL-17 promoter and the CNS2 region, a vector expressing Renilla luciferase, and vectors expressing RORγt, Bcl6 wild-type, various Bcl6 mutants, or vector alone. The firefly luciferase activity was determined and normalized to Renilla luciferase. Values were also normalized to vector alone. The graph shows means ± SD. (D and E) Naïve OT-II T cells were activated under TH1 conditions and infected with the indicated viruses. GFP+ cells were restimulated with antibody to CD3, and mRNA expression of the indicated genes was analyzed by real-time RT-PCR (D). The data shown were normalized to the expression of reference gene Actb. The graph shows means ± SD. *P < 0.005; **P < 0.001, t test. IFNγ expression was analyzed by intracellular staining on FACS-sorted GFP+ cells (E). Numbers in dot-plot quadrants represent the percentages. The data represent at least three independent experiments with consistent results.
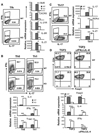
Fig. 3
Bcl6 deficiency causes defective T cell differentiation in vitro. Naïve CD4+ T cells from _Bcl6_−/− mice and their littermate control mice carrying the OT-II TcR transgene were activated under TFH (A), TH0 and TH1 (B), TH17 (C), and Treg (TGFβ or TGFβ with antibodies to IL-4 and IFNγ) (D) conditions. Five days later, cells were assessed for IFNγ and IL-17 production [(A) to (C)] or Foxp3 expression (D) using intracellular staining. Numbers in FACS plot quadrants represent the percentages. mRNA expression of various genes was analyzed by real-time RT-PCR, and the data shown were normalized to the expression of reference gene β-actin. The graph shows means ± SD. P values were calculated using a t test comparing wild-type and _Bcl6_−/− CD4+ T cells and are indicated as follows: *P < 0.005; **P < 0.001. The experiments were repeated three times with consistent results.
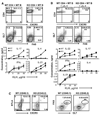
Fig. 4
Bcl6 is necessary for the generation of TFH cells in vivo. (A and B) Naïve CD4+ cells from wild-type (WT) or _Bcl6_−/− mice were mixed with WT B cells and transferred into _Rag1_−/− mice (3 mice per group). The recipient mice were immunized subcutaneously with KLH emulsified in Freund’s complete adjuvant (FCA). In (B), recipient mice were also treated with antibody to IL-4. Seven days after the immunization, germinal center B cells were determined by staining with GL-7, FAS and B220 antibodies, and TFH cells by CD4 and CXCR5 antibodies. Numbers in dot-plot quadrants represent the percentages in gated T and B cells, respectively. Spleen cells from immunized mice were stimulated with the indicated concentration of KLH. Effector cytokines were measured after 4 days of treatment. The graph shows means ± SD. P values were calculated using a t test comparing CXCR5 expression on T cells or GL7/Fas expression on B cells between mice transferred with WT or Bcl6-deficient T and B cells, respectively, and are indicated as follows: *P < 0.005; **P < 0.001. The results are representative of multiple mice (n = 6 per group) from two independent experiments with similar results. (C) Mixed–bone marrow chimeric mice (n = 15) were generated and immunized with KLH in FCA. Spleen cells were stained with antibody to CD45.2 to distinguish WT and Bcl6 knockout compartments and then analyzed for the germinal center B cells and TFH cells. P values were calculated using a t test comparing CXCR5 and GL7/Fas expression between WT and Bcl6-deficient T and B cells, respectively, and are indicated as follows: *P < 0.005; **P < 0.001. The results are a representative of multiple mice (n = 15) from three independent experiments with similar results.
Comment in
- Immunology. The yin and yang of follicular helper T cells.
Awasthi A, Kuchroo VK. Awasthi A, et al. Science. 2009 Aug 21;325(5943):953-5. doi: 10.1126/science.1178752. Science. 2009. PMID: 19696339 No abstract available.
Similar articles
- Bcl6 and Blimp-1 are reciprocal and antagonistic regulators of T follicular helper cell differentiation.
Johnston RJ, Poholek AC, DiToro D, Yusuf I, Eto D, Barnett B, Dent AL, Craft J, Crotty S. Johnston RJ, et al. Science. 2009 Aug 21;325(5943):1006-10. doi: 10.1126/science.1175870. Epub 2009 Jul 16. Science. 2009. PMID: 19608860 Free PMC article. - Generation of T follicular helper cells is mediated by interleukin-21 but independent of T helper 1, 2, or 17 cell lineages.
Nurieva RI, Chung Y, Hwang D, Yang XO, Kang HS, Ma L, Wang YH, Watowich SS, Jetten AM, Tian Q, Dong C. Nurieva RI, et al. Immunity. 2008 Jul 18;29(1):138-49. doi: 10.1016/j.immuni.2008.05.009. Epub 2008 Jul 3. Immunity. 2008. PMID: 18599325 Free PMC article. - Insights into the role of Bcl6 in follicular Th cells using a new conditional mutant mouse model.
Hollister K, Kusam S, Wu H, Clegg N, Mondal A, Sawant DV, Dent AL. Hollister K, et al. J Immunol. 2013 Oct 1;191(7):3705-11. doi: 10.4049/jimmunol.1300378. Epub 2013 Aug 26. J Immunol. 2013. PMID: 23980208 Free PMC article. - IL-21 and T follicular helper cells.
Spolski R, Leonard WJ. Spolski R, et al. Int Immunol. 2010 Jan;22(1):7-12. doi: 10.1093/intimm/dxp112. Epub 2009 Nov 23. Int Immunol. 2010. PMID: 19933709 Free PMC article. Review. - The darker side of follicular helper T cells: from autoimmunity to immunodeficiency.
Shekhar S, Yang X. Shekhar S, et al. Cell Mol Immunol. 2012 Sep;9(5):380-5. doi: 10.1038/cmi.2012.26. Epub 2012 Aug 13. Cell Mol Immunol. 2012. PMID: 22885524 Free PMC article. Review.
Cited by
- B Cell Lymphoma 6 (BCL6): A Conserved Regulator of Immunity and Beyond.
Liongue C, Almohaisen FLJ, Ward AC. Liongue C, et al. Int J Mol Sci. 2024 Oct 11;25(20):10968. doi: 10.3390/ijms252010968. Int J Mol Sci. 2024. PMID: 39456751 Free PMC article. Review. - Clinical significance of T helper cell subsets in the peripheral blood and bone marrow of patients with multiple myeloma.
Zhang L, Zhong H, Fan J, Mao J, Li Y. Zhang L, et al. Front Immunol. 2024 Sep 11;15:1445530. doi: 10.3389/fimmu.2024.1445530. eCollection 2024. Front Immunol. 2024. PMID: 39324138 Free PMC article. - Generation of antigen-specific memory CD4 T cells by heterologous immunization enhances the magnitude of the germinal center response upon influenza infection.
Sircy LM, Ramstead AG, Gibbs LC, Joshi H, Baessler A, Mena I, García-Sastre A, Emerson LL, Fairfax KC, Williams MA, Hale JS. Sircy LM, et al. PLoS Pathog. 2024 Sep 16;20(9):e1011639. doi: 10.1371/journal.ppat.1011639. eCollection 2024 Sep. PLoS Pathog. 2024. PMID: 39283916 Free PMC article. - Clinical and prognostic significance of follicular helper and regulatory T cells in bladder cancer draining lymph nodes.
Mansourabadi Z, Ariafar A, Chenari N, Hakimellahi H, Vahidi Y, Faghih Z. Mansourabadi Z, et al. Sci Rep. 2024 Sep 2;14(1):20358. doi: 10.1038/s41598-024-70675-1. Sci Rep. 2024. PMID: 39223192 Free PMC article. - Tertiary lymphoid structures in diseases: immune mechanisms and therapeutic advances.
Zhao L, Jin S, Wang S, Zhang Z, Wang X, Chen Z, Wang X, Huang S, Zhang D, Wu H. Zhao L, et al. Signal Transduct Target Ther. 2024 Aug 28;9(1):225. doi: 10.1038/s41392-024-01947-5. Signal Transduct Target Ther. 2024. PMID: 39198425 Free PMC article. Review.
References
- Vinuesa CG, Tangye SG, Moser B, Mackay CR. Nat. Rev. Immunol. 2005;5:853. - PubMed
- King C, Tangye SG, Mackay CR. Annu. Rev. Immunol. 2008;26:741. - PubMed
- Vogelzang A, et al. Immunity. 2008;29:127. - PubMed
Publication types
MeSH terms
Substances
Grants and funding
- R01 AI050746-05/AI/NIAID NIH HHS/United States
- R01 AI050746/AI/NIAID NIH HHS/United States
- R01 AR050772-08/AR/NIAMS NIH HHS/United States
- R01 AR050772-07/AR/NIAMS NIH HHS/United States
- R01 AR050772/AR/NIAMS NIH HHS/United States
- R01 AI083761/AI/NIAID NIH HHS/United States
- R01 AI050761-06/AI/NIAID NIH HHS/United States
- R01 AI050761-07A1/AI/NIAID NIH HHS/United States
- R01 AI050761/AI/NIAID NIH HHS/United States
- R01 AI050761-05/AI/NIAID NIH HHS/United States
LinkOut - more resources
Full Text Sources
Other Literature Sources
Molecular Biology Databases
Research Materials
Miscellaneous


