The major component in schistosome eggs responsible for conditioning dendritic cells for Th2 polarization is a T2 ribonuclease (omega-1) - PubMed (original) (raw)
The major component in schistosome eggs responsible for conditioning dendritic cells for Th2 polarization is a T2 ribonuclease (omega-1)
Svenja Steinfelder et al. J Exp Med. 2009.
Abstract
Schistosoma mansoni eggs contain factors that trigger potent Th2 responses in vivo and condition mouse dendritic cells (DCs) to promote Th2 lymphocyte differentiation. Using an in vitro bystander polarization assay as the readout, we purified and identified the major Th2-inducing component from soluble egg extract (SEA) as the secreted T2 ribonuclease, omega-1. The Th2-promoting activity of omega-1 was found to be sensitive to ribonuclease inhibition and did not require MyD88/TRIF signaling in DCs. In common with unfractioned SEA, the purified native protein suppresses lipopolysaccharide-induced DC activation, but unlike SEA, it fails to trigger interleukin 4 production from basophils. Importantly, omega-1-exposed DCs displayed pronounced cytoskeletal changes and exhibited decreased antigen-dependent conjugate formation with CD4(+) T cells. Based on this evidence, we hypothesize that S. mansoni omega-1 acts by limiting the interaction of DCs with CD4(+) T lymphocytes, thereby lowering the strength of the activation signal delivered.
Figures
Figure 1.
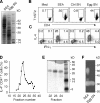
S. mansoni egg culture supernatants promote bystander Th2 polarization. (A) Protein composition of SEA and egg supernatants evaluated by Coomassie blue–stained SDS-PAGE. (B and C) Naive DO.11.10 Tg CD4+ lymphocytes were cultured with DC and OVA peptide with or without 40 µg/ml SEA, 30 µg/ml egg supernatant, or control supernatants from mock cultures containing no eggs. After restimulation with PMA/ionomycin, cells were stained for CD4 and T1/ST2 (B) or CD4 and IL-4 plus IFN-γ (C), respectively. The FACS dot plots shown are gated on CD4+ T lymphocytes (percentages are shown). The experiment shown is representative of more than five performed. (D) The frequency of IL-4+ DO.11.10 T cells determined by intracellular cytokine staining (ICS) in response to gel filtration fractions of egg culture supernatants. (E) Coomassie blue–stained SDS-PAGE of fractions 22–24 from the column shown in D. Results are representative of two independent experiments performed with different egg culture supernatant preparations. (F) In situ ribonuclease activity of a 32-kD protein in both SEA and egg supernatants detected by zymogram gel.
Figure 2.
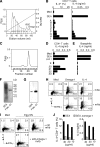
Identification of omega-1 as the major component with Th2-inducing activity in SEA. (A) The elution profile of SEA from an SP-Sepharose column indicating the pools (pools A–I) tested for biological activity. The diagonal line indicates the gradient of NaCl. (B) Th2 response of DO.11.10 Tg cells induced by the different pools in A was measured by ICS and IL-4 secretion. The results from an assay performed at one fixed protein concentration (20 µg/ml) for each pool are shown, along with 40 µg/ml SEA as a positive control. Bars represent the percentage of IL-4+ CD4+ T lymphocytes, and the means ± SD of the IL-4 concentrations. The same pattern of activity was observed when three additional twofold serial dilutions were compared for each pool (not depicted). (C) The elution profile of pool I after separation on a Superdex 75 gel filtration column. (D and E) The indicated fractions were tested in Th2 polarization (D) and basophil (E) assays. Bars represent means ± SD for IL-4 measured by ELISA. (F) Coomassie blue–stained SDS-PAGE of SEA and fraction 21 from the column in C. (G) Western blot of SEA and fraction 21 developed with mAb specific for omega-1. (H and I) Flow cytometry of ICS performed on DO.11.10 Tg T cells stimulated with OVA/DCs in the presence of omega-1 or IL-4 preincubated with or without anti–omega-1 mAb (H) or in the presence of egg supernatants preincubated with control or anti–omega-1 mAb (I). The dot plots are gated on CD4+ T lymphocytes (percentages are shown). (J) Loss of Th2 activity in SEA depleted of omega-1 measured by ICS and IL-4 secretion in a DO.11.10 Tg T cell assay as described. The experiments shown in A–G and H–J are representative of two and three experiments, respectively.
Figure 3.
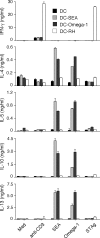
Omega-1–pulsed DCs promote Th2-type responses in vivo. BALB/c mice were injected s.c. with BMDCs unstimulated or incubated overnight with 30 µg/ml SEA, 2 µg/ml omega-1, or irradiated T. gondii (RH strain) tachyzoites (1:1). 1.5 × 10⁶ popliteal LN cells/ml from individual animals (n = 3) were pooled by mixing equal numbers of cells from each animal within a group and stimulated with 0.2 µg/ml anti-CD3 mAb, 30 µg/ml SEA, 0.5 µg/ml omega-1, or 10 µg/ml of soluble tachyzoite antigen (STAg). Cytokines were measured by ELISA in 72-h supernatants. Data shown are means ± SD of ELISA values for each pool. ICS was performed after supernatant removal. When restimulated with SEA, the frequency of IL-4+ CD4+ T cells in pooled LN cultures from mice that received SEA- or omega-primed DCs was 14 and 8.8%, respectively, and when the same cultures were restimulated with omega-1 the frequencies were 7.2 and 7.9%. One representative experiment out of three performed is shown. When omega-1–pretreated B cells were injected instead of DCs, no immune response was detected (not depicted).
Figure 4.
The Th2-polarizing function of both SEA and omega-1 is sensitive to ribonuclease inhibition. (A and B) Equal amounts of DEPC-treated or -untreated unfractionated SEA (40 µg/ml) or purified omega-1 (0.5 µg/ml) were added to the DC/DO.11.10 Tg CD4 T cell cultures, and IL-4 secretion was measured on day 3 by ELISA (A) and the frequency of IL-4+ cells was assayed by ICS on day 7 after restimulation with anti-CD3 mAb (B). Bars represent means ± SD for IL-4. The dot plots shown are gated on CD4+ T lymphocytes (percentages are shown). When DEPC-treated SEA or DEPC-treated omega-1 was added to the cultures in the presence of exogenous rIL-4, to evaluate possible nonspecific inhibitory effects of carryover DEPC, no decrease in the frequency of IL-4+ DO.11.10+ T cells was observed (not depicted). The data shown are representative of two experiments performed.
Figure 5.
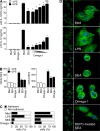
Omega-1 suppresses TLR ligand–mediated DC activation and induces cytoskeletal changes in DCs. (A and B) BMDCs were incubated in medium, 40 µg/ml SEA, or 1 µg/ml omega-1 with or without 40 ng/ml LPS. (A) Levels of p40 IL-12/23 and p70 IL-12 measured by ELISA. When tested in the presence of LPS, twofold dilutions of omega-1 (1–0.06 µg/ml) were assayed. Bars represent mean cytokine concentrations ± SD. *, P < 0.05; and NS refer to IL-12 secretion induced by LPS alone versus in the presence of SEA or omega-1. (B) Surface expression of CD40 and CD54 on DCs in the same cultures. Bars represent geometric mean fluorescences ± SD of two experiments. (C and D) BMDCs were cultured in medium, 40 ng/ml LPS, 40 µg/ml SEA, or 0.5 µg/ml omega-1 for 12 h. (C) The number of viable cells was determined in adherent versus nonadherent populations after culture on nontreated (left) or tissue culture–treated (right) plates. Bars indicate the frequency of cells in the two subpopulations for each culture condition. Results are from one representative experiment out of three performed. (D) CD11c+ BMDCs cultured on multichamber glass slides under the same conditions were stained with phalloidin (green) and DAPI (blue) and analyzed by confocal microscopy. (left) Images demonstrate the homogeneity of cell populations; (right) A zoom-in view, which is a projection of a z-stack. The photomicrographs shown are representative images from five fields examined in one experiment out of three performed. Bars, 5 µm. MFI, mean fluorescence intensity.
Figure 6.
Omega-1–exposed DCs are less efficient in forming conjugates with CD4+ T cells. (A and B) BMDCs were cultured on nontreated plates with the same stimuli as in Fig. 5 C, pulsed with increasing amounts of OVA peptide, and incubated with OT-II Tg CD4+ T cells. The frequency of CD4+ T cell–forming conjugates with DC was measured by FACS. (A) A representative set of contour plots gated on CD4+ T lymphocytes (percentages are shown). (B) Quantification of T cells forming conjugates with DCs (means ± SD for duplicates) from one experiment (top). Fold increase in the frequency of OT-II Tg CD4+ T cells in conjugates with DCs was calculated as a function of peptide concentration for each type of DC based on the results from four independent experiments performed, of which two included omega-1 (bottom). (C and D) OT-II Tg T cells were cultured in the presence of DCs and increasing concentrations of OVA peptide for 36 h. Cultures with 1 µg/ml of peptide were tested with and without 0.5 µg/ml omega-1. (C) Viability of CD4+ T cells determined by PI staining of ungated populations (top). The contour plots gated on the CD4+ PI− population shows the percentage of cells that have completed the first cell cycle as determined by CFSE dilution (bottom). Cell size is indicated by forward scatter (FSC) on the y axis. (D) IL-2 in corresponding cultures measured by ELISA. Data shown are the mean concentrations ± SD. The data shown in C and D are representative of two experiments.
Similar articles
- Omega-1, a glycoprotein secreted by Schistosoma mansoni eggs, drives Th2 responses.
Everts B, Perona-Wright G, Smits HH, Hokke CH, van der Ham AJ, Fitzsimmons CM, Doenhoff MJ, van der Bosch J, Mohrs K, Haas H, Mohrs M, Yazdanbakhsh M, Schramm G. Everts B, et al. J Exp Med. 2009 Aug 3;206(8):1673-80. doi: 10.1084/jem.20082460. Epub 2009 Jul 27. J Exp Med. 2009. PMID: 19635864 Free PMC article. - Uncoupling of induced protein processing from maturation in dendritic cells exposed to a highly antigenic preparation from a helminth parasite.
Marshall FA, Pearce EJ. Marshall FA, et al. J Immunol. 2008 Dec 1;181(11):7562-70. doi: 10.4049/jimmunol.181.11.7562. J Immunol. 2008. PMID: 19017945 Free PMC article. - Schistosoma mansoni egg antigen-mediated modulation of Toll-like receptor (TLR)-induced activation occurs independently of TLR2, TLR4, and MyD88.
Kane CM, Jung E, Pearce EJ. Kane CM, et al. Infect Immun. 2008 Dec;76(12):5754-9. doi: 10.1128/IAI.00497-08. Epub 2008 Sep 29. Infect Immun. 2008. PMID: 18824534 Free PMC article. - Priming of the immune response by schistosome eggs.
Pearce EJ. Pearce EJ. Parasite Immunol. 2005 Jul-Aug;27(7-8):265-70. doi: 10.1111/j.1365-3024.2005.00765.x. Parasite Immunol. 2005. PMID: 16138847 Review. - Th2 response polarization during infection with the helminth parasite Schistosoma mansoni.
Pearce EJ, M Kane C, Sun J, J Taylor J, McKee AS, Cervi L. Pearce EJ, et al. Immunol Rev. 2004 Oct;201:117-26. doi: 10.1111/j.0105-2896.2004.00187.x. Immunol Rev. 2004. PMID: 15361236 Review.
Cited by
- Dendritic cell expression of the C-type lectin receptor CD209a: A novel innate parasite-sensing mechanism inducing Th17 cells that drive severe immunopathology in murine schistosome infection.
Ponichtera HE, Stadecker MJ. Ponichtera HE, et al. Exp Parasitol. 2015 Nov;158:42-7. doi: 10.1016/j.exppara.2015.04.006. Epub 2015 Apr 23. Exp Parasitol. 2015. PMID: 25913088 Free PMC article. - Helminth-derived immunomodulators: can understanding the worm produce the pill?
Harnett W, Harnett MM. Harnett W, et al. Nat Rev Immunol. 2010 Apr;10(4):278-84. doi: 10.1038/nri2730. Epub 2010 Mar 12. Nat Rev Immunol. 2010. PMID: 20224568 Review. - Innate Immune Response Regulation by the Human RNASET2 Tumor Suppressor Gene.
Acquati F, Mortara L, De Vito A, Baci D, Albini A, Cippitelli M, Taramelli R, Noonan DM. Acquati F, et al. Front Immunol. 2019 Nov 5;10:2587. doi: 10.3389/fimmu.2019.02587. eCollection 2019. Front Immunol. 2019. PMID: 31749812 Free PMC article. Review. - Programming dendritic cells to induce T(H)2 and tolerogenic responses.
Pulendran B, Tang H, Manicassamy S. Pulendran B, et al. Nat Immunol. 2010 Aug;11(8):647-55. doi: 10.1038/ni.1894. Epub 2010 Jul 20. Nat Immunol. 2010. PMID: 20644570 Review. - Stress-induced RNASET2 overexpression mediates melanocyte apoptosis via the TRAF2 pathway in vitro.
Wang Q, Jiang M, Wu J, Ma Y, Li T, Chen Q, Zhang X, Xiang L. Wang Q, et al. Cell Death Dis. 2014 Jan 23;5(1):e1022. doi: 10.1038/cddis.2013.539. Cell Death Dis. 2014. PMID: 24457966 Free PMC article.
References
- Abbas A.K., Murphy K.M., Sher A. 1996. Functional diversity of helper T lymphocytes.Nature. 383:787–793 - PubMed
- Aksoy E., Zouain C.S., Vanhoutte F., Fontaine J., Pavelka N., Thieblemont N., Willems F., Ricciardi-Castagnoli P., Goldman M., Capron M., et al. 2005. Double-stranded RNAs from the helminth parasite Schistosoma activate TLR3 in dendritic cells.J. Biol. Chem. 280:277–283 - PubMed
- Al-Alwan M.M., Liwski R.S., Haeryfar S.M., Baldridge W.H., Hoskin D.W., Rowden G., West K.A. 2003. Cutting edge: dendritic cell actin cytoskeletal polarization during immunological synapse formation is highly antigen-dependent.J. Immunol. 171:4479–4483 - PubMed
- Ashton P.D., Harrop R., Shah B., Wilson R.A. 2001. The schistosome egg: development and secretions.Parasitology. 122:329–338 - PubMed
Publication types
MeSH terms
Substances
LinkOut - more resources
Full Text Sources
Other Literature Sources
Molecular Biology Databases
Research Materials


