Smoking-dependent reprogramming of alveolar macrophage polarization: implication for pathogenesis of chronic obstructive pulmonary disease - PubMed (original) (raw)
Smoking-dependent reprogramming of alveolar macrophage polarization: implication for pathogenesis of chronic obstructive pulmonary disease
Renat Shaykhiev et al. J Immunol. 2009.
Abstract
When exposed to a specific microenvironment, macrophages acquire either M1- or M2-polarized phenotypes associated with inflammation and tissue remodeling, respectively. Alveolar macrophages (AM) directly interact with environmental stimuli such as cigarette smoke, the major risk factor for chronic obstructive pulmonary disease (COPD), a disease characterized by lung inflammation and remodeling. Transcriptional profiling of AM obtained by bronchoalveolar lavage of 24 healthy nonsmokers, 34 healthy smokers, and 12 COPD smokers was performed to test the hypothesis whether smoking alters AM polarization, resulting in a disease-relevant activation phenotype. The analysis revealed that AM of healthy smokers exhibited a unique polarization pattern characterized by substantial suppression of M1-related inflammatory/immune genes and induction of genes associated with various M2-polarization programs relevant to tissue remodeling and immunoregulation. Such reciprocal changes progressed with the development of COPD, with M1-related gene expression being most dramatically down-regulated (p < 0.0001 vs healthy nonsmokers, p < 0.002 vs healthy smokers). Results were confirmed with TaqMan real-time PCR and flow cytometry. Among progressively down-regulated M1-related genes were those encoding type I chemokines CXCL9, CXCL10, CXCL11, and CCL5. Progressive activation of M2-related program was characterized by induction of tissue remodeling and immunoregulatory genes such as matrix metalloproteinase (MMP)2, MMP7, and adenosine A3 receptor (ADORA3). Principal component analysis revealed that differential expression of polarization-related genes has substantial contribution to global AM phenotypes associated with smoking and COPD. In summary, the data provide transcriptome-based evidence that AM likely contribute to COPD pathogenesis in a noninflammatory manner due to their smoking-induced reprogramming toward M1-deactivated, partially M2-polarized macrophages.
Figures
Figure 1
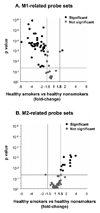
Smoking-mediated reciprocal induction of M1 and M2 polarization programs of human alveolar macrophages. A. Volcano plot of M1-related probe sets significantly differently expressed between healthy nonsmokers (n=24) and healthy smokers (n=34). B. Volcano plot for the M2-related gene probe sets comparing the same groups. For both panels, the x-axis corresponds to the fold-change and the y-axis corresponds to p value. Red dots represent significant differentially expressed probe sets, grey dots represent probe sets with no significant difference between healthy smokers and healthy nonsmokers. The changes in gene expression were considered statistically significant based on the criteria of fold-change ≥1.5, p<0.05 with Benjamini-Hochberg correction.
Figure 2
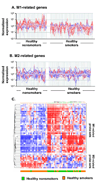
Biologic phenotypes of healthy smokers compared to healthy nonsmokers based on alveolar macrophage M1- and M2-related gene expression. A. Expression of all M1-related probe sets in AM of healthy nonsmokers (n=24; left panels) compared to that of healthy smokers (n=34; right panels). See Table II for a list of all M1-related probes. B. Expression of all M2-related probe sets in AM comparing the same groups (healthy nonsmokers, left; healthy smokers, right). See Table III for a list of all M2-related probes. For both A and B, the y-axis indicates normalized relative expression levels for the probe sets, the x-axis shows the individuals belonging to each group randomly ordered but of similar order in A and B. Red = gene probe sets down-regulated in healthy smokers as compared to healthy nonsmokers; blue = gene probe sets up-regulated in healthy smokers as compared to healthy smokers. Intensity of color indicates the degree of down- or up-regulation. Note that overall, the M1-related genes tend to be down-regulated in the healthy smokers compared to the healthy nonsmokers. The opposite is observed among the M2-related genes, but not to the same extent as the down-regulation of the M1 genes. C. Non-supervised hierarchical cluster analysis of AM M1- and M2-related gene expression of healthy nonsmokers and healthy smokers. The analysis is based on healthy smokers, the differential expression of M1- and M2- related genes of the same groups of healthy nonsmokers (n=24) and healthy smokers (n=34) using Spearman correlation as a similarity measure and an average linkage as a clustering algorithm. Statistically significant differentially expressed M1- and M2-gene probe sets were used as input data set. Genes expressed above average are represented in red, below average in blue, and average in white. The genes are represented vertically, and individual subjects horizontally at the bottom. Healthy nonsmokers are indicated by green, healthy smokers by orange. Although, there is variability within each group, compared to the healthy nonsmokers, the general tendency for the healthy smokers is for the M1 genes to be down-regulated and the M2 genes up-regulated.
Figure 3
Progressive reciprocal alteration of M1- and M2-related gene expression in alveolar macrophages with the development of COPD. A. Normalized expression levels of all M1-related probe sets; B. M1-related probe sets significantly differentially expressed in AM of COPD smokers vs healthy nonsmokers; C. All M2-related probe sets; and D. M2-related probe sets significantly differentially expressed in AM of COPD smokers vs healthy nonsmokers. The data is based on healthy nonsmokers (n=24), healthy smokers (n=34) and COPD smokers (n=12). The y-axis indicates mean normalized, expression levels for the probe sets in each group; the x-axis indicates the groups. p values represent differences among groups as indicated.
Figure 4
Examples of AM expression of M1 and M2 polarization-related genes demonstrating progressive differences with the development of COPD. A. M1-related genes; and B. M2-related genes. Log2-transformed normalized expression levels for selected M1-related genes [C-X-C chemokine ligand 11 (CXCL11); C-X-C chemokine ligand 9 (CXCL9); guanylate binding protein (GBP 5)]; and M2-related genes [adenosine A3 receptor (ADORA3); matrix metalloprotease 2 (MMP2); and matrix metalloproteinase 7 (MMP7), are plotted for all healthy nonsmokers (n=24; green triangles), healthy smokers (n=32; orange triangles), and COPD smokers (n=12; blue triangles). p values are indicated. N.S., non-significant.
Figure 5
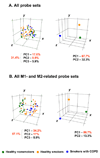
Principle component analysis (PCA) comparison of alveolar macrophage gene expression patterns of healthy smokers, healthy smokers and COPD smokers. A. PCA of all 26,959 probe sets expressed in AM of at least 20% of subjects. B. PCA of all 114 M1- and M2-related probe sets expressed in AM of at least 20% of subjects (see Tables I, II). In both analyses, all samples within each group were centered (left panels) or averaged and then the means were centered (right panels) in the three-dimensional space based on the expression pattern. In left panels, each circle represents an individual sample; in right panels, each circle represents an averaged sample for each group. Healthy nonsmokers, n=24, green; healthy smokers, n=34, orange; and COPD smokers, n=12, blue). The percentage contributions of the first three (left panels) or two (right panels) principal components (PC) to the observed variability between the groups are indicated.
Similar articles
- Dual polarization of human alveolar macrophages progressively increases with smoking and COPD severity.
Bazzan E, Turato G, Tinè M, Radu CM, Balestro E, Rigobello C, Biondini D, Schiavon M, Lunardi F, Baraldo S, Rea F, Simioni P, Calabrese F, Saetta M, Cosio MG. Bazzan E, et al. Respir Res. 2017 Feb 23;18(1):40. doi: 10.1186/s12931-017-0522-0. Respir Res. 2017. PMID: 28231829 Free PMC article. - Differential gene expression analysis in human monocyte-derived macrophages: impact of cigarette smoke on host defence.
Doyle I, Ratcliffe M, Walding A, Vanden Bon E, Dymond M, Tomlinson W, Tilley D, Shelton P, Dougall I. Doyle I, et al. Mol Immunol. 2010 Feb;47(5):1058-65. doi: 10.1016/j.molimm.2009.11.008. Mol Immunol. 2010. PMID: 20022114 - Smoking alters alveolar macrophage recognition and phagocytic ability: implications in chronic obstructive pulmonary disease.
Hodge S, Hodge G, Ahern J, Jersmann H, Holmes M, Reynolds PN. Hodge S, et al. Am J Respir Cell Mol Biol. 2007 Dec;37(6):748-55. doi: 10.1165/rcmb.2007-0025OC. Epub 2007 Jul 13. Am J Respir Cell Mol Biol. 2007. PMID: 17630319 - Macrophage Polarization and Functions in Pathogenesis of Chronic Obstructive Pulmonary Disease.
Kim GD, Lim EY, Shin HS. Kim GD, et al. Int J Mol Sci. 2024 May 22;25(11):5631. doi: 10.3390/ijms25115631. Int J Mol Sci. 2024. PMID: 38891820 Free PMC article. Review. - [Traditional Chinese medicine and active ingredients regulate M1/M2 macrophage polarization balance to treat chronic obstructive pulmonary disease: a review].
Deng YS, Fan YP, Zheng YQ, Xi LH, Li WY, Liang TW, Huang H, Lin J. Deng YS, et al. Zhongguo Zhong Yao Za Zhi. 2024 Aug;49(16):4298-4312. doi: 10.19540/j.cnki.cjcmm.20240513.701. Zhongguo Zhong Yao Za Zhi. 2024. PMID: 39307767 Review. Chinese.
Cited by
- Full Spectrum of LPS Activation in Alveolar Macrophages of Healthy Volunteers by Whole Transcriptomic Profiling.
Pinilla-Vera M, Xiong Z, Zhao Y, Zhao J, Donahoe MP, Barge S, Horne WT, Kolls JK, McVerry BJ, Birukova A, Tighe RM, Foster WM, Hollingsworth J, Ray A, Mallampalli R, Ray P, Lee JS. Pinilla-Vera M, et al. PLoS One. 2016 Jul 19;11(7):e0159329. doi: 10.1371/journal.pone.0159329. eCollection 2016. PLoS One. 2016. PMID: 27434537 Free PMC article. - Type V collagen-induced nasal tolerance prevents lung damage in an experimental model: new evidence of autoimmunity to collagen V in COPD.
Robertoni FSZ, Velosa APP, Oliveira LM, de Almeida FM, da Silveira LKR, Queiroz ZAJ, Lobo TM, Contini VE, Baldavira CM, Carrasco S, Fernezlian SM, Sato MN, Capelozzi VL, Lopes FDTQDS, Teodoro WPR. Robertoni FSZ, et al. Front Immunol. 2024 Sep 5;15:1444622. doi: 10.3389/fimmu.2024.1444622. eCollection 2024. Front Immunol. 2024. PMID: 39301030 Free PMC article. - Macrophage heterogeneity in respiratory diseases.
Boorsma CE, Draijer C, Melgert BN. Boorsma CE, et al. Mediators Inflamm. 2013;2013:769214. doi: 10.1155/2013/769214. Epub 2013 Feb 27. Mediators Inflamm. 2013. PMID: 23533311 Free PMC article. Review. - Pathogenesis of chronic obstructive pulmonary disease.
Tuder RM, Petrache I. Tuder RM, et al. J Clin Invest. 2012 Aug;122(8):2749-55. doi: 10.1172/JCI60324. Epub 2012 Aug 1. J Clin Invest. 2012. PMID: 22850885 Free PMC article. Review. - Maternal Nicotine Exposure Alters Hippocampal Microglia Polarization and Promotes Anti-inflammatory Signaling in Juvenile Offspring in Mice.
Zhou L, Tao X, Pang G, Mu M, Sun Q, Liu F, Hu Y, Tao H, Li B, Xu K. Zhou L, et al. Front Pharmacol. 2021 May 11;12:661304. doi: 10.3389/fphar.2021.661304. eCollection 2021. Front Pharmacol. 2021. PMID: 34045967 Free PMC article.
References
- Gordon S, Taylor PR. Monocyte and macrophage heterogeneity. Nat. Rev. Immunol. 2005;5:953–964. - PubMed
- Goerdt S, Orfanos CE. Other functions, other genes: alternative activation of antigen-presenting cells. Immunity. 1999;10:137–142. - PubMed
- Gordon S. Alternative activation of macrophages. Nat. Rev. Immunol. 2003;3:23–35. - PubMed
- Mantovani A, Sica A, Sozzani S, Allavena P, Vecchi A, Locati M. The chemokine system in diverse forms of macrophage activation and polarization. Trends Immunol. 2004;25:677–686. - PubMed
- Bezdicek P, Crystal RG. Pulmonary macrophages. In: Crystal RG, West JB, Weibel ER, Barnes PJ, editors. The Lung: Scientific Foundations. Philadelphia: Lippincott-Raven Publishers; 1997. p. 859.
Publication types
MeSH terms
Substances
Grants and funding
- R01 HL074326/HL/NHLBI NIH HHS/United States
- UL1 RR024996-02/RR/NCRR NIH HHS/United States
- R01 HL074326-04/HL/NHLBI NIH HHS/United States
- P50 HL084936-01/HL/NHLBI NIH HHS/United States
- P50 HL084936/HL/NHLBI NIH HHS/United States
- UL1 RR024996/RR/NCRR NIH HHS/United States
- U54RR024385/RR/NCRR NIH HHS/United States
- UL1-RR024996/RR/NCRR NIH HHS/United States
LinkOut - more resources
Full Text Sources
Other Literature Sources
Medical
Molecular Biology Databases
Research Materials
Miscellaneous


