In vivo phosphorylation site mapping in mouse cardiac troponin I by high resolution top-down electron capture dissociation mass spectrometry: Ser22/23 are the only sites basally phosphorylated - PubMed (original) (raw)
In vivo phosphorylation site mapping in mouse cardiac troponin I by high resolution top-down electron capture dissociation mass spectrometry: Ser22/23 are the only sites basally phosphorylated
Serife Ayaz-Guner et al. Biochemistry. 2009.
Abstract
Cardiac troponin I (cTnI) is the inhibitory subunit of cardiac troponin, a key myofilament regulatory protein complex located on the thin filaments of the contractile apparatus. cTnI is uniquely specific for the heart and is widely used in clinics as a serum biomarker for cardiac injury. Phosphorylation of cTnI plays a critical role in modulating cardiac function. cTnI is known to be regulated by protein kinase A and protein kinase C at five sites, Ser22/Ser23, Ser42/44, and Thr143, primarily based on results from in vitro phosphorylation assays by the specific kinase(s). However, a comprehensive characterization of phosphorylation of mouse cTnI occurring in vivo has been lacking. Herein, we have employed top-down mass spectrometry (MS) methodology with electron capture dissociation for precise mapping of in vivo phosphorylation sites of cTnI affinity purified from wild-type and transgenic mouse hearts. As demonstrated, top-down MS (analysis of intact proteins) is an extremely valuable technology for global characterization of labile phosphorylation occurring in vivo without a priori knowledge. Our top-down MS data unambiguously identified Ser22/23 as the only two sites basally phosphorylated in wild-type mouse cTnI with full sequence coverage, which was confirmed by the lack of phosphorylation in cTnI-Ala(2) transgenic mice where Ser22/23 in cTnI have been rendered nonphosphorylatable by mutation to alanine.
Figures
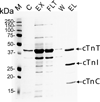
Figure 1
Immunoaffinity purification of cTn complexes from mouse hearts. SDS–PAGE analysis of affinity purified cardiac troponin complex stained with Coomassie Blue. M, molecular weight markers, C, chicken cTn (obtained from Sigma-Aldrich), EX, extracted cardiac myofilament proteins; FLT, column flow through; W, wash; EL, elution of troponin complex.
Figure 2
High resolution MS analysis of intact cTnI purified from wild-type mouse hearts. Bottom panel: ESI/FTMS spectrum of cTnI showing it is mono- and bis-phosphorylated. N-terminally proteolytic degraded products of cTnI were also observed. Top panel: isotopically resolved molecular ions of un-, mono-, and bis-phosphorylated cTnI (M29+) with highly accurate molecular weights measured. _p_cTnI and _pp_cTnI represent mono- (+79.97 Da, HPO3), and bis-phosphorylated (+159.92 Da, 2 HPO3) cTnI. +Na indicates cTnI ion with sodium adduct peaks. Circles represent the theoretical isotopic abundance distribution of the isotopomer peaks corresponding to the assigned mass. Dashed arrow indicates the expected position of tris-phosphorylated cTnI (_ppp_cTnI), which is not observed here. Calc’d, calculated most abundant molecular weight; Expt’l, experimental most abundant molecular weight.
Figure 3
Gas-phase separation (purification) of cTnI phosphorylated ions. Isolation of a single charge state (M29+) of a mixture of un-, mono-, and bis-phosphorylated cTnI (A), monophosphorylated cTnI alone (B), and bis-phosphorylated cTnI alone (C). _p_cTnI and _pp_cTnI represent mono-, and bis-phosphorylated cTnI, respectively.
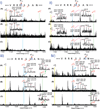
Figure 4
Localization of basal phosphorylation sites to Ser22/23 in wild-type mouse cTnI by ECD mass spectrometry. (I–IV) Representative spectra of doubly charged (2+) **c21–c**24 fragment ions, respectively, from ECD of a single charge state (M29+) of a mixture of un-, mono-, and bis-phosphorylated cTnI (A), monophosphorylated cTnI alone (B), and bis-phosphorylated cTnI alone (C). pc and ppc represent mono- and bis-phosphorylated c fragmentation ions. The abbreviated amino acid sequences for ions **c21–c**24 were accordingly denoted on top of each panel. The positively identified isotopomer peak profiles of un-, mono-, and bis-phosphorylated **c21–c**24 (2+) ions were correspondingly expanded in each spectrum. Circles represent the theoretical isotopic abundance distribution of the isotopomer peaks corresponding to the assigned molecular weight. Calc’d, calculated most abundant molecular weight; Expt’l, experimental most abundant molecular weight.
Figure 5
MS/MS product map from the ECD spectra for assignments to mouse cTnI. Fragment assignments were made to the DNA-predicted sequence of mouse cTnI (UnitProtKB/Swiss-Prot P48787, TNNI3_mouse) with the removal of N-terminal methionine and acetylation at the new terminus. (A) ECD of a single charge state (M29+) of a mixture of un-, mono-, and bis-phosphorylated cTnI; (B) ECD of one charge state (M29+) of monophosphorylated cTnI alone; (C) ECD of a single charge state (M29+) of bis-phosphorylated cTnI alone. Square, both un- and monophosphorylated fragment ions were observed. Star, un-, mono-, and bis-phosphorylated ions were observed. Single dot, only monophosphorylated fragment ions observed. Double dots, only bis-phosphorylated fragment ions were observed. Ser22 and Ser23 are highlighted in circles.
Figure 6
(A) High resolution MS analysis of cTnI affinity purified from cTnI-Ala2 transgenic mouse hearts. No phosphorylated ions were detected, confirming Ser22 and Ser23 are the only basally phosphorylated sites in wild-type mouse cTnI. N-terminally proteolytic degraded products of cTnI were also observed. Inset, isotopically resolved molecular ions of unphosphorylated cTnI (M29+) with highly accurate molecular weight measured. Dashed arrow indicates the expected position of monophosphorylated cTnI from cTnT-Ala2 transgenic mice (_p_cTnI-Ala2), which is not observed here. +Na indicates cTnI ion with sodium adduct peaks. Circles represent the theoretical abundance isotopic distribution of the isotopomer peaks corresponding to the assigned mass. Calc’d, calculated most abundant molecular weight; Expt’l, experimental most abundant molecular weight. (B) SDS–PAGE analysis of myofilament proteins extracted from both wild-type and cTnI-Ala2 transgenic mouse hearts stained with Pro-Q diamond. Only lower molecular weight regions are shown. Lane 1, WT, wild-type mouse; lane 2, Ala2, cTnI-Ala2 transgenicmouse. cTnT, cardiac troponin T; Tm, tropomyosin; LC2, myosin regulatory light chain 2.
Similar articles
- Unraveling molecular complexity of phosphorylated human cardiac troponin I by top down electron capture dissociation/electron transfer dissociation mass spectrometry.
Zabrouskov V, Ge Y, Schwartz J, Walker JW. Zabrouskov V, et al. Mol Cell Proteomics. 2008 Oct;7(10):1838-49. doi: 10.1074/mcp.M700524-MCP200. Epub 2008 Apr 28. Mol Cell Proteomics. 2008. PMID: 18445579 - Protein kinase D is a novel mediator of cardiac troponin I phosphorylation and regulates myofilament function.
Haworth RS, Cuello F, Herron TJ, Franzen G, Kentish JC, Gautel M, Avkiran M. Haworth RS, et al. Circ Res. 2004 Nov 26;95(11):1091-9. doi: 10.1161/01.RES.0000149299.34793.3c. Epub 2004 Oct 28. Circ Res. 2004. PMID: 15514163 - Deciphering modifications in swine cardiac troponin I by top-down high-resolution tandem mass spectrometry.
Zhang J, Dong X, Hacker TA, Ge Y. Zhang J, et al. J Am Soc Mass Spectrom. 2010 Jun;21(6):940-8. doi: 10.1016/j.jasms.2010.02.005. Epub 2010 Feb 10. J Am Soc Mass Spectrom. 2010. PMID: 20223681 Free PMC article. - Single amino acid sequence polymorphisms in rat cardiac troponin revealed by top-down tandem mass spectrometry.
Sancho Solis R, Ge Y, Walker JW. Sancho Solis R, et al. J Muscle Res Cell Motil. 2008;29(6-8):203-12. doi: 10.1007/s10974-009-9168-y. Epub 2009 Jan 23. J Muscle Res Cell Motil. 2008. PMID: 19165611 Free PMC article. Review. - Troponin I modulation of cardiac performance: Plasticity in the survival switch.
Biesiadecki BJ, Westfall MV. Biesiadecki BJ, et al. Arch Biochem Biophys. 2019 Mar 30;664:9-14. doi: 10.1016/j.abb.2019.01.025. Epub 2019 Jan 23. Arch Biochem Biophys. 2019. PMID: 30684464 Free PMC article. Review.
Cited by
- A preferred AMPK phosphorylation site adjacent to the inhibitory loop of cardiac and skeletal troponin I.
Sancho Solis R, Ge Y, Walker JW. Sancho Solis R, et al. Protein Sci. 2011 May;20(5):894-907. doi: 10.1002/pro.623. Epub 2011 Apr 8. Protein Sci. 2011. PMID: 21416543 Free PMC article. - Top-down mass spectrometry: recent developments, applications and perspectives.
Cui W, Rohrs HW, Gross ML. Cui W, et al. Analyst. 2011 Oct 7;136(19):3854-64. doi: 10.1039/c1an15286f. Epub 2011 Aug 8. Analyst. 2011. PMID: 21826297 Free PMC article. Review. - Top-down proteomics in health and disease: challenges and opportunities.
Gregorich ZR, Ge Y. Gregorich ZR, et al. Proteomics. 2014 May;14(10):1195-210. doi: 10.1002/pmic.201300432. Proteomics. 2014. PMID: 24723472 Free PMC article. Review. - Top-down mass spectrometry of cardiac myofilament proteins in health and disease.
Peng Y, Ayaz-Guner S, Yu D, Ge Y. Peng Y, et al. Proteomics Clin Appl. 2014 Aug;8(7-8):554-68. doi: 10.1002/prca.201400043. Proteomics Clin Appl. 2014. PMID: 24945106 Free PMC article. Review. - Tissue procurement strategies affect the protein biochemistry of human heart samples.
Walker LA, Medway AM, Walker JS, Cleveland JC Jr, Buttrick PM. Walker LA, et al. J Muscle Res Cell Motil. 2011 Mar;31(5-6):309-14. doi: 10.1007/s10974-010-9233-6. Epub 2010 Dec 24. J Muscle Res Cell Motil. 2011. PMID: 21184256
References
- Solaro RJ, Rarick HM. Troponin and tropomyosin: Proteins that switch on and tune in the activity of cardiac myofilaments. Circ. Res. 1998;83:471–480. - PubMed
- Kobayashi T, Solaro RJ. Calcium, thin filaments, and the integrative biology of cardiac contractility. Annu. Rev. Physiol. 2005;67:39–67. - PubMed
- Takeda S, Yamashita A, Maeda K, Maeda Y. Structure of the core domain of human cardiac troponin in the Ca2+-saturated form. Nature. 2003;424:35–41. - PubMed
- Huang XP, Pi YQ, Lee KJ, Henkel AS, Gregg RG, Powers PA, Walker JW. Cardiac troponin I gene knockout: A mouse model of myocardial troponin I deficiency. Circ. Res. 1999;84:1–8. - PubMed
- Murphy AM, Kogler H, Georgakopoulos D, McDonough JL, Kass DA, Van Eyk JE, Marban E. Transgenic mouse model of stunned myocardium. Science. 2000;287:488–491. - PubMed
Publication types
MeSH terms
Substances
LinkOut - more resources
Full Text Sources
Other Literature Sources
Molecular Biology Databases
Research Materials


