Stimulation of homology-directed gene targeting at an endogenous human locus by a nicking endonuclease - PubMed (original) (raw)
Stimulation of homology-directed gene targeting at an endogenous human locus by a nicking endonuclease
Gijsbert P van Nierop et al. Nucleic Acids Res. 2009 Sep.
Abstract
Homologous recombination (HR) is a highly accurate mechanism of DNA repair that can be exploited for homology-directed gene targeting. Since in most cell types HR occurs very infrequently (approximately 10(-6) to 10(-8)), its practical application has been largely restricted to specific experimental systems that allow selection of the few cells that become genetically modified. HR-mediated gene targeting has nonetheless revolutionized genetics by greatly facilitating the analysis of mammalian gene function. Recent studies showed that generation of double-strand DNA breaks at specific loci by designed endonucleases greatly increases the rate of homology-directed gene repair. These findings opened new perspectives for HR-based genome editing in higher eukaryotes. Here, we demonstrate by using donor DNA templates together with the adeno-associated virus (AAV) Rep78 and Rep68 proteins that sequence- and strand-specific cleavage at a native, predefined, human locus can also greatly enhance homology-directed gene targeting. Our findings argue for the development of other strategies besides direct induction of double-strand chromosomal breaks to achieve efficient and heritable targeted genetic modification of cells and organisms. Finally, harnessing the cellular HR pathway through Rep-mediated nicking expands the range of strategies that make use of AAV elements to bring about stable genetic modification of human cells.
Figures
Figure 1.
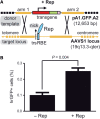
Stable genetic modification of human cells with a targeting vector containing sequences homologous to the genomic region flanking the RBE and trs of AAVS1. (A) Schematic representation of the experimental setup used to test the capacity of a nicking endonuclease to induce homology-directed gene targeting at a native human locus. The episomal donor template pA1.GFP.A2 (12.7 kb) contains a 4.1-kb transcription unit consisting of the EF1α promoter (red box), the hrGFP ORF (green box) and the simian virus 40 polyadenylation signal (pink box). This transcription unit is flanked by sequences homologous to those framing the trs (vertical thin black line) and RBE (cyan box) at the chromosomal acceptor site (i.e. the AAVS1 locus on human chromosome 19 at 19q13.3-qter; thick horizontal yellow lines). Homology arms 1 and 2 are 2063 and 4381 bp in length, respectively. Black crosses represent crossing-over events between homologous DNA segments that lead to targeted gene addition. (B) Flow cytometric quantification of stably transduced human cells. HeLa cells were co-transfected with pA1.GFP.A2 and an ‘empty’ control vector (−Rep) or with pA1.GFP.A2 and the AAV serotype 2 _rep78/68_-expression construct pGAPDH.Rep78/68 (+Rep). The overall frequency of genetically modified cells (i.e. irrespective of whether they were stably transduced via random or via _AAVS1_-targeted exogenous DNA insertion events) was determined at 44 days post-transfection through hrGFP-based flow cytometric analysis of 100 000 events per sample. Bars represent mean ± SEM of three independent experiments.
Figure 2.
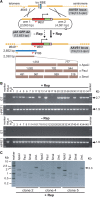
PCR assays to identify cells genetically modified through homology-directed gene targeting. (A) Overview of the PCR assays carried out on genomic DNA of stably transduced HeLa cells clonally expanded from cultures exposed (+Rep) or not exposed (−Rep) to pGAPDH.Rep78/68. The AAVS1 locus is depicted before and after HR with the donor template pA1.GFP.A2. HR-mediated transgene insertion should yield 2.7-kb PCR products using primers #649 and #651 (horizontal dark blue bar). The specificity of these amplicons can be confirmed by semi-nested PCR using primers #649 and #186 combined with restriction fragment length analyses of the resulting 2.3-kb DNA species (horizontal brown bars). The numbers above the brown bars refer to restriction fragment sizes. Open circle, prokaryotic origin of replication. For an explanation of the other symbols see the legend of Figure 1. (B) PCR analysis carried out on chromosomal DNA of parental HeLa cells (HeLa) and of clones derived from HeLa cells co-transfected with pA1.GFP.A1 and pGAPDH.Rep78/68 (+Rep) or with pA1.GFP.A2 and ‘empty plasmid’ (−Rep). The panels labeled GT display the results of amplification reactions performed with primers #649 and #651, which are specific for the AAVS1 locus and the EF1α promoter, respectively. PCR amplifications targeting a 1.9-kb segment of the HPRT1 were carried out in parallel to ascertain the integrity of the genomic DNA corresponding to individual HeLa cell clones (see panels marked HPRT1). PCR mixtures containing water instead of DNA served as a negative control (H2O). The positions and sizes (in kilo base pairs) of specific PCR products are indicated at the right. Marker, Gene Ruler DNA Ladder Mix molecular weight marker (Fermentas). (C) Characterization of the 2.7-kb amplification products obtained with primers #649 and #651 by semi-nested PCR and restriction enzyme fragment length analyses. A semi-nested PCR using primers #649 and #186 was performed on the 2.7-kb amplicons corresponding to clones 2, 4 and 5. The resulting 2.3-kb PCR products were subjected to agarose gel electrophoresis after digestion with ApaLI, PauI or SmaI. Und., undigested PCR fragments.
Figure 3.
Investigation of targeted versus random chromosomal insertion of exogenous DNA through restriction mapping and Southern blot analyses. (A) Diagram of the Southern blot assay performed on ApaLI-digested chromosomal DNA extracted from randomly selected clones of pA1.GFP.A2-transfected HeLa cells. The ApaLI restriction map of the AAVS1 locus is depicted before and after HR with the donor template pA1.GFP.A2. Non-targeted and targeted human chromosome 19 alleles are expected to give rise to 7.1- and 9.9-kb ApaLI DNA fragments, respectively, using the _AAVS1_-specific probe (orange horizontal bar). The 9.9-kb DNA species should also be specifically recognized by the transgene-specific probe, which spans the entire hrGFP ORF (green horizontal bar). Both DNA probes are drawn in relation to their target sequences. For an explanation of the other symbols see the legend of Figure 1. (B) Southern blots of ApaLI-digested chromosomal DNA of parental HeLa cells (HeLa) and of clones derived from HeLa cells co-transfected with pA1.GFP.A1 and pGAPDH.Rep78/68 (+Rep) or with pA1.GFP.A2 and ‘empty plasmid’ (−Rep). The open arrowheads point at the 9.9-kb DNA fragments expected to emerge following homology-directed gene targeting at AAVS1. The open arrows mark higher molecular weight DNA species that are also recognized by both probes indicating insertion of exogenous DNA at AAVS1 loci that underwent local Rep78/68-induced DNA amplification/rearrangement. The 12.7-kb ApaLI-linearized pA1.GFP.A2 DNA (solid arrowhead in lower panel) served as an internal control for probe binding specificity and removal. The solid arrowhead in the upper panel points at the 7.1-kb ApaLI fragments derived from unmodified AAVS1 alleles. Marker, Gene Ruler DNA Ladder Mix molecular weight ladder (Fermentas).
Figure 4.
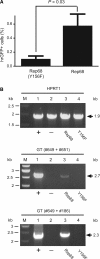
Testing the capacity of endonuclease-proficient Rep68 and endonuclease-deficient Rep68(Y156F) proteins to stimulate homology-directed gene targeting at AAVS1. (A) Quantification by flow cytometry of stably transduced HeLa cells following co-transfection with pA1.GFP.A2 and pGAPDH.Rep68(Y156F) or with pA1.GFP.A2 and pGAPDH.Rep68 (Rep68). The frequency of genetically modified cells was determined at 27 days post-transfection through hrGFP-based flow cytometric analysis of 10 000 events per sample. Bars represent mean ± SEM of three independent experiments. (B) Agarose gel electrophoresis of PCR products resulting from amplifications carried out on chromosomal DNA from HeLa cell clone 25 (Figure 2B, upper two panels) (lane 1), parental HeLa cells (lane 2) and HeLa cell populations 1 month after co-transfection with pA1.GFP.A2 and pGAPDH.Rep68 (lane 3) or with pA1.GFP.A2 and pGAPDH.Rep68(Y156F) (lane 4). Lanes M, Gene Ruler DNA Ladder Mix molecular weight marker. Upper panel, internal control PCR products resulting from amplifications performed with the human _HPRT1_-specific primers hHPRT.1 (#49) and hHPRT.2 (#50). Middle panel, PCR species obtained after amplifications carried out with oligodeoxyribonucleotides #649 and #651 (Figure 2A, upper panel). Lower panel, semi-nested PCR products resulting from PCR reactions using primers #649 and #186 (Figure 2A, upper panel) on 0.004% of the DNA synthesized with the aid of oligodeoxyribonucleotides #649 and #651. The positions and sizes (in kilo base pairs) of the various amplicons are indicated by solid arrows.
Figure 5.
Rep68 dose dependency of HR-mediated gene targeting at AAVS1. (A) Phase-contrast microscopy (upper panel) and hrGFP direct fluorescence microscopy (lower panel) of HeLa cells that were mock-transfected (mock) and of HeLa cells that were transfected with targeting vector pA1.GFP.A2 mixed with ‘empty plasmid’ (−Rep) or mixed with plasmid pGAPDH.Rep68(Y156F) encoding the endonuclease-deficient version of Rep68 Y156F. In parallel, phase-contrast microscopy (upper panel) and hrGFP direct fluorescence microscopy (lower panel) was carried out on HeLa cells transfected with pA1.GFP.A2 together with increasing amounts of rep68 expression construct pGAPDH.Rep68 (i.e. 1, 3.3, 10, 33.3 and 100 ng). The total amount of transfected recombinant DNA was kept constant by adding, whenever required, extra ‘empty plasmid’. Micrographs were acquired at 72-h post-transfection. Numerals below the various columns correspond to the deployed amounts (in nanograms) of the rep68 expression plasmids and of the pA1.GFP.A2 targeting DNA. Original magnification: 100×. (B) Agarose gel electrophoresis of PCR products resulting from amplifications performed on genomic DNA samples with the aid of primers #649 and #651 plus primers #649 and #186 (upper panel), as diagrammed in Figure 2A. Genomic DNA was isolated at 4 days post-transfection from mock-transfected HeLa cells (mock), from HeLa cells co-transfected with pA1.GFP.A2 and ‘empty plasmid’ (−Rep), from HeLa cells co-transfected with pA1.GFP.A2 and pGAPDH.Rep68(Y156F) (Y156F), and from HeLa cells transfected with pA1.GFP.A2 mixed with increasing amounts of pGAPDH.Rep68 (i.e. 1, 3.3, 10, 33.3 and 100 ng) (upper panel). The negative (−) and positive (+) controls were obtained using nuclease-free water and genomic DNA isolated from HeLa cell clone 25 (Figure 2B, upper two panels) as starting material. Lanes M, Gene Ruler DNA Ladder Mix molecular weight marker. Agarose gel electrophoresis of PCR species resulting from amplifications performed with the aid of the human _HPRT1_-specific primers hHPRT.1 (#49) and hHPRT.2 (#50) (lower panel). These reactions were carried out in parallel and served as an internal control to monitor chromosomal DNA integrity. The positions and sizes (in kilo base pairs) of the amplicons are indicated by solid arrows.
Figure 6.
Nucleotide sequence analysis of centromeric and telomeric junctions between endogenous and exogenous DNA corresponding to three independent Rep78/68-induced HR events. (A) Diagrammatic representation of the hrGFP transcription unit (red, green and pink boxes) inserted at 19q13.3-qter (thick horizontal yellow lines) following homology-directed gene targeting using as donor template pA1.GFP.A2 DNA. Primers used to amplify the left- and right-hand junctions (dark and light blue half arrows, respectively) are drawn in relation to their recognition sequences. The 2.7- and 5.4-kb PCR products specific for the telomeric and centromeric junctions are indicated by dark and light blue bars, respectively. (B) Primary nucleotide sequence data corresponding to transition regions between the homology arms of pA1.GFP.A2 and outward host chromosomal DNA and between the homology arms of pA1.GFP.A2 and inward transgene DNA.
Similar articles
- Roles of adeno-associated virus Rep protein and human chromosome 19 in site-specific recombination.
Young SM Jr, McCarty DM, Degtyareva N, Samulski RJ. Young SM Jr, et al. J Virol. 2000 May;74(9):3953-66. doi: 10.1128/jvi.74.9.3953-3966.2000. J Virol. 2000. PMID: 10756007 Free PMC article. - Concerted nicking of donor and chromosomal acceptor DNA promotes homology-directed gene targeting in human cells.
Gonçalves MA, van Nierop GP, Holkers M, de Vries AA. Gonçalves MA, et al. Nucleic Acids Res. 2012 Apr;40(8):3443-55. doi: 10.1093/nar/gkr1234. Epub 2011 Dec 20. Nucleic Acids Res. 2012. PMID: 22189101 Free PMC article. - A Rep recognition sequence is necessary but not sufficient for nicking of DNA by adeno-associated virus type-2 Rep proteins.
Wu J, Davis MD, Owens RA. Wu J, et al. Arch Biochem Biophys. 2001 May 15;389(2):271-7. doi: 10.1006/abbi.2001.2348. Arch Biochem Biophys. 2001. PMID: 11339817 - The democratization of gene editing: Insights from site-specific cleavage and double-strand break repair.
Jasin M, Haber JE. Jasin M, et al. DNA Repair (Amst). 2016 Aug;44:6-16. doi: 10.1016/j.dnarep.2016.05.001. Epub 2016 May 12. DNA Repair (Amst). 2016. PMID: 27261202 Free PMC article. Review. - Opportunities and challenges with CRISPR-Cas mediated homologous recombination based precise editing in plants and animals.
Singh S, Chaudhary R, Deshmukh R, Tiwari S. Singh S, et al. Plant Mol Biol. 2023 Jan;111(1-2):1-20. doi: 10.1007/s11103-022-01321-5. Epub 2022 Oct 31. Plant Mol Biol. 2023. PMID: 36315306 Review.
Cited by
- Inverted terminal repeats of adeno-associated virus decrease random integration of a gene targeting fragment in Saccharomyces cerevisiae.
Galli A, Cervelli T. Galli A, et al. BMC Mol Biol. 2014 Feb 13;15:5. doi: 10.1186/1471-2199-15-5. BMC Mol Biol. 2014. PMID: 24521444 Free PMC article. - Engineering a Nickase on the Homing Endonuclease I-DmoI Scaffold.
Molina R, Marcaida MJ, Redondo P, Marenchino M, Duchateau P, D'Abramo M, Montoya G, Prieto J. Molina R, et al. J Biol Chem. 2015 Jul 24;290(30):18534-44. doi: 10.1074/jbc.M115.658666. Epub 2015 Jun 4. J Biol Chem. 2015. PMID: 26045557 Free PMC article. - Generation of interleukin-2 receptor gamma gene knockout pigs from somatic cells genetically modified by zinc finger nuclease-encoding mRNA.
Watanabe M, Nakano K, Matsunari H, Matsuda T, Maehara M, Kanai T, Kobayashi M, Matsumura Y, Sakai R, Kuramoto M, Hayashida G, Asano Y, Takayanagi S, Arai Y, Umeyama K, Nagaya M, Hanazono Y, Nagashima H. Watanabe M, et al. PLoS One. 2013 Oct 9;8(10):e76478. doi: 10.1371/journal.pone.0076478. eCollection 2013. PLoS One. 2013. PMID: 24130776 Free PMC article. - Performance of the Cas9 nickase system in Drosophila melanogaster.
Ren X, Yang Z, Mao D, Chang Z, Qiao HH, Wang X, Sun J, Hu Q, Cui Y, Liu LP, Ji JY, Xu J, Ni JQ. Ren X, et al. G3 (Bethesda). 2014 Aug 15;4(10):1955-62. doi: 10.1534/g3.114.013821. G3 (Bethesda). 2014. PMID: 25128437 Free PMC article. - Homologous recombination rescues ssDNA gaps generated by nucleotide excision repair and reduced translesion DNA synthesis in yeast G2 cells.
Ma W, Westmoreland JW, Resnick MA. Ma W, et al. Proc Natl Acad Sci U S A. 2013 Jul 30;110(31):E2895-904. doi: 10.1073/pnas.1301676110. Epub 2013 Jul 15. Proc Natl Acad Sci U S A. 2013. PMID: 23858457 Free PMC article.
References
- van Gent DC, Hoeijmakers JH, Kanaar R. Chromosomal stability and the DNA double-stranded break connection. Nat. Rev. Genet. 2001;2:196–206. - PubMed
- Porter AC, Itzhaki JE. Gene targeting in human somatic cells. Complete inactivation of an interferon-inducible gene. Eur. J. Biochem. 1993;218:273–281. - PubMed
- Ganguly A, Smelt S, Mewar R, Fertala A, Sieron AL, Overhauser J, Prockop DJ. Targeted insertions of two exogenous collagen genes into both alleles of their endogenous loci in cultures human cells: the insertions are directed by relatively short fragments containing the promoters and the 5′ ends of the genes. Proc. Natl Acad. Sci. USA. 1994;91:7365–7369. - PMC - PubMed
Publication types
MeSH terms
Substances
LinkOut - more resources
Full Text Sources
Other Literature Sources


