Why Do We Test Multiple Traits in Genetic Association Studies? - PubMed (original) (raw)
Why Do We Test Multiple Traits in Genetic Association Studies?
Wensheng Zhu et al. J Korean Stat Soc. 2009.
Abstract
In studies of complex disorders such as nicotine dependence, it is common that researchers assess multiple variables related to a disorder as well as other disorders that are potentially correlated with the primary disorder of interest. In this work, we refer to those variables and disorders broadly as multiple traits. The multiple traits may or may not have a common causal genetic variant. Intuitively, it may be more powerful to accommodate multiple traits in genetic traits, but the analysis of multiple traits is generally more complicated than the analysis of a single trait. Furthermore, it is not well documented as to how much power we may potentially gain by considering multiple traits. Our aim is to enhance our understanding on this important and practical issue. We considered a variety of correlation structures between traits and the disease locus. To focus on the effect of accommodating multiple traits, we examined genetic models that are relatively simple so that we can pinpoint the factors affecting the power. We conducted simulation studies to explore the performance of testing multiple traits simultaneously and the performance of testing a single trait at a time in family-based association studies. Our simulation results demonstrated that the performance of testing multiple traits simultaneously is better than that of testing each trait individually for almost models considered. We also found that the power of association tests varies among the underlying models. The advantage of conducting a multiple traits test is minimized when some traits are influenced by the gene only through other traits; and it is maximized when there are causal relations between the traits and the gene, and among the traits themselves or when there are extraneous traits.
Figures
Figure 1
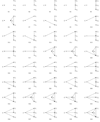
Forty causal structures among one disease gene G and three traits _Y_1, _Y_2 and _Y_3 that are illustrated by DAGs. The arrows from G to Yj and from Yk to Yj represent that there exist direct effects of G on Yj and Yk on Yj for j, k = 1, 2, 3. The locations of _Y_1, _Y_2 and _Y_3 can be exchanged arbitrarily in each structure.
Figure 2
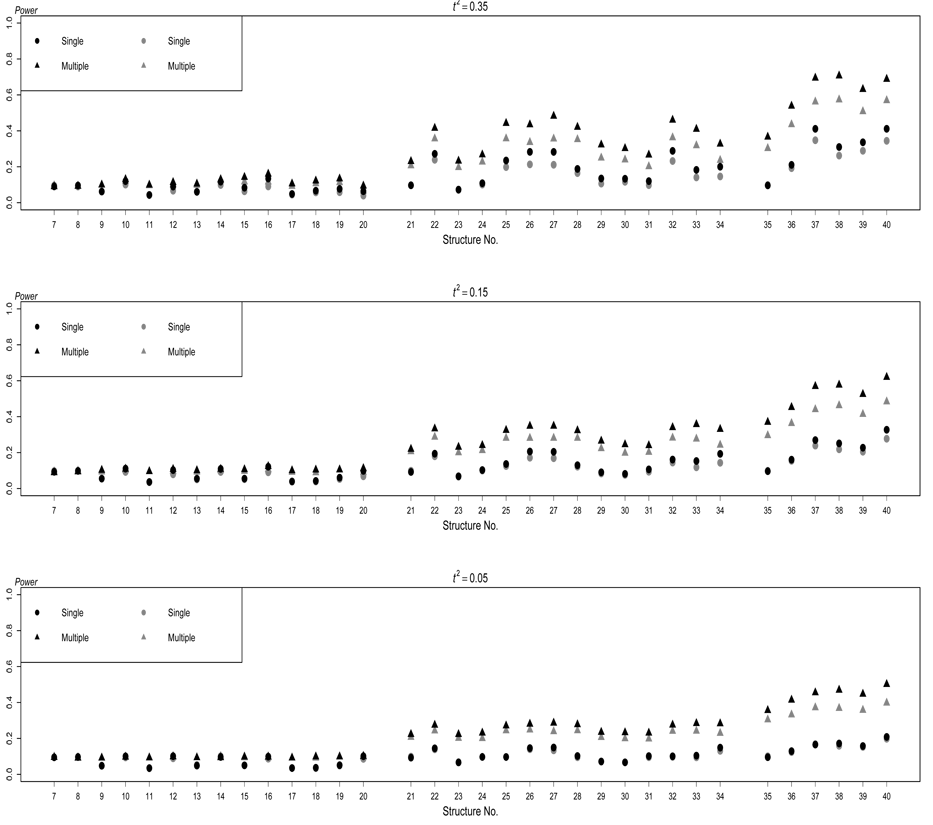
Power of the two testing methods based on structures S7–S40 for quantitative traits. The black dots and the black triangles respectively represent the performance of single-trait test and multiple-trait test in absence of any extraneous variables, and the gray dots and the gray triangles respectively represent the performance of single-trait test and multiple-trait test in presence of extraneous variables, which result in positive correlations among traits. The nominal significance level is 0.01.
Figure 3
Power of the two testing methods based on structures S7–S40 for quantitative traits. The black dots and the black triangles respectively represent the performance of single-trait test and multiple-trait test in absence of any extraneous variables, and the gray dots and the gray triangles respectively represent the performance of single-trait test and multiple-trait test in presence of extraneous variables, which result in negative correlations among traits. The nominal significance level is 0.01.
Figure 4
Power of the two testing methods based on structures S7–S40 for binary traits. The black dots and the black triangles respectively represent the performance of singletrait test and multiple-trait test in absence of any extraneous variables, and the gray dots and the gray triangles respectively represent the performance of single-trait test and multiple-trait test in presence of extraneous variables, which result in positive correlations among traits. The nominal significance level is 0.01.
Figure 5
Power of the two testing methods based on structures S7–S40 for binary traits. The black dots and the black triangles respectively represent the performance of singletrait test and multiple-trait test in absence of any extraneous variables, and the gray dots and the gray triangles respectively represent the performance of single-trait test and multiple-trait test in presence of extraneous variables, which result in negative correlations among traits. The nominal significance level is 0.01.
Similar articles
- Integrate multiple traits to detect novel trait-gene association using GWAS summary data with an adaptive test approach.
Guo B, Wu B. Guo B, et al. Bioinformatics. 2019 Jul 1;35(13):2251-2257. doi: 10.1093/bioinformatics/bty961. Bioinformatics. 2019. PMID: 30476000 Free PMC article. - Joint Analysis of Multiple Traits in Rare Variant Association Studies.
Wang Z, Wang X, Sha Q, Zhang S. Wang Z, et al. Ann Hum Genet. 2016 May;80(3):162-71. doi: 10.1111/ahg.12149. Epub 2016 Mar 16. Ann Hum Genet. 2016. PMID: 26990300 Free PMC article. - Powerful and Adaptive Testing for Multi-trait and Multi-SNP Associations with GWAS and Sequencing Data.
Kim J, Zhang Y, Pan W; Alzheimer's Disease Neuroimaging Initiative. Kim J, et al. Genetics. 2016 Jun;203(2):715-31. doi: 10.1534/genetics.115.186502. Epub 2016 Apr 13. Genetics. 2016. PMID: 27075728 Free PMC article. - A Comparison Study of Fixed and Mixed Effect Models for Gene Level Association Studies of Complex Traits.
Fan R, Chiu CY, Jung J, Weeks DE, Wilson AF, Bailey-Wilson JE, Amos CI, Chen Z, Mills JL, Xiong M. Fan R, et al. Genet Epidemiol. 2016 Dec;40(8):702-721. doi: 10.1002/gepi.21984. Epub 2016 Jul 4. Genet Epidemiol. 2016. PMID: 27374056 Free PMC article. - MF-TOWmuT: Testing an optimally weighted combination of common and rare variants with multiple traits using family data.
Gao C, Sha Q, Zhang S, Zhang K. Gao C, et al. Genet Epidemiol. 2021 Feb;45(1):64-81. doi: 10.1002/gepi.22355. Epub 2020 Oct 13. Genet Epidemiol. 2021. PMID: 33047835
Cited by
- An Association Test for Multiple Traits Based on the Generalized Kendall's Tau.
Zhang H, Liu CT, Wang X. Zhang H, et al. J Am Stat Assoc. 2010 Jun;105(490):473-481. doi: 10.1198/jasa.2009.ap08387. J Am Stat Assoc. 2010. PMID: 20711441 Free PMC article. - A comparison of multivariate genome-wide association methods.
Galesloot TE, van Steen K, Kiemeney LA, Janss LL, Vermeulen SH. Galesloot TE, et al. PLoS One. 2014 Apr 24;9(4):e95923. doi: 10.1371/journal.pone.0095923. eCollection 2014. PLoS One. 2014. PMID: 24763738 Free PMC article. - A nonparametric regression method for multiple longitudinal phenotypes using multivariate adaptive splines.
Zhu W, Zhang H. Zhu W, et al. Front Math China. 2013 Jun 1;8(3):731-743. doi: 10.1007/s11464-012-0256-8. Front Math China. 2013. PMID: 25309585 Free PMC article. - Associating Multivariate Quantitative Phenotypes with Genetic Variants in Family Samples with a Novel Kernel Machine Regression Method.
Yan Q, Weeks DE, Celedón JC, Tiwari HK, Li B, Wang X, Lin WY, Lou XY, Gao G, Chen W, Liu N. Yan Q, et al. Genetics. 2015 Dec;201(4):1329-39. doi: 10.1534/genetics.115.178590. Epub 2015 Oct 19. Genetics. 2015. PMID: 26482791 Free PMC article. - Nonparametric Covariate-Adjusted Association Tests Based on the Generalized Kendall's Tau().
Zhu W, Jiang Y, Zhang H. Zhu W, et al. J Am Stat Assoc. 2012 Jan 1;107(497):1-11. doi: 10.1080/01621459.2011.643707. Epub 2012 Jun 11. J Am Stat Assoc. 2012. PMID: 22745516 Free PMC article.
References
- Beyene J, Tritchler D, on behalf of Group 12 Multivariate analysis of complex gene expression and clinical phenotypes with genetic marker data. Genetic Epidemiology. 2007;31 Supplement 1:S103–S109. - PubMed
- Fagerstrom KO. Measuring degree of physical dependence to tobacco smoking with reference to individualization of treatment. Addictive Behaviors. 1978;3:235–241. - PubMed
- Laird NM, Horvath S, Xu X. Implementing a unified approach to family-based tests of association. Genetic Epidemiology. 2000;19 Supplement 1:S36–S42. - PubMed
- Laird NM, Lange C. Family-based designs in the age of large-scale gene-association studies. Nature Reviews Genetics. 2006;7:385–394. - PubMed
Grants and funding
- K02 DA017713/DA/NIDA NIH HHS/United States
- K02 DA017713-05/DA/NIDA NIH HHS/United States
- R01 DA016750/DA/NIDA NIH HHS/United States
- R01 DA016750-05/DA/NIDA NIH HHS/United States
LinkOut - more resources
Full Text Sources


