Persistent low-level viremia in HIV-1 elite controllers and relationship to immunologic parameters - PubMed (original) (raw)
. 2009 Sep 15;200(6):984-90.
doi: 10.1086/605446.
Sarah Palmer, Toshiyuki Miura, Brian L Block, Ann Wiegand, Alissa C Rothchild, Brett Baker, Rachel Rosenberg, Emily Cutrell, Michael S Seaman, John M Coffin, Bruce D Walker
Affiliations
- PMID: 19656066
- PMCID: PMC3725728
- DOI: 10.1086/605446
Persistent low-level viremia in HIV-1 elite controllers and relationship to immunologic parameters
Florencia Pereyra et al. J Infect Dis. 2009.
Abstract
Background: Human immunodeficiency virus type 1 (HIV-1) elite controllers are able to control virus replication to levels below the limits of detection by commercial assays, but the actual level of viremia in these individuals is not well defined. Here, we quantify plasma HIV-1 RNA in elite controllers and correlate this with specific immunologic parameters.
Methods: Plasma HIV-1 RNA levels were quantified in 90 elite controllers with use of a real time reverse-transcriptase polymerase chain reaction assay with a sensitivity of 0.2 copies/mL. HIV-1-specific immune responses and longitudinal CD4(+) T cell counts were examined.
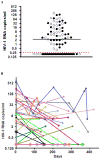
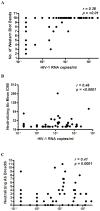
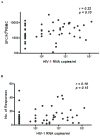
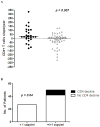
Results: The median plasma HIV-1 RNA level was 2 copies/mL (interquartile range, 0.2-14 copies/mL). A longitudinal analysis of 31 elite controllers demonstrated 2-5-fold fluctuations in viremia in the majority of individuals; 6 had persistent levels below 1 copy/mL. Viremia correlated directly with HIV-1-specific neutralizing antibodies and Western blot reactivity but not with CD8(+) T cell responses. Absolute CD4(+) T cell decrease was more common among individuals with detectable viremia (P = .04).
Conclusions: Low-level viremia is present in the majority of elite controllers and is associated with higher HIV-1-specific antibody responses. Absolute CD4(+) T cell loss is more common among viremic individuals, suggesting that even very low-level viremia has negative consequences over time.
Conflict of interest statement
We have no conflicts of interest to disclose.
Figures
Figure 1
Plasma HIV-1 RNA virus load distribution among 83 elite controllers. The cut-off level of 0.2 copies/ml is represented by the dotted red line. The median is indicated with the black horizontal bar. The arithmetic mean HIV-1 RNA virus load for each subject is shown. Open circles represent patients with longitudinal HIV-1 RNA values; filled circles represent subjects with single time point virus load determinations. (B) Longitudinal HIV-1 RNA virus load in 31 elite controllers. Each line represents one study subject. Subjects with all HIV-1 RNA determinations below 1 copy/ml are shown with asterisks (n = 6).
Figure 2
Antibody responses to HIV-1 in elite controllers. Mean plasma virus load is plotted against (A) the number of virion proteins recognized by HIV antibodies, as detected by Western blot; (B) the mean neutralizing antibody ID80 titer; and (C) the breadth of neutralizing antibody response as measured by number of heterologous HIV Env-pseudoviruses neutralized by patient plasma. Statistical analysis is based on non-parametric Spearman test.
Figure 3
CD8+ T cell responses in elite controllers. (A) Correlation between plasma virus load and total magnitude of the CD8+ T cell response measured by Elispot and given in spot forming cells (SFC)/106 PBMC; (B) Total breadth of the CD8+ T cell response given in number of peptides targeted throughout the entire proteome. Statistical analysis was based on the non-parametric Spearman test.
Figure 4
The change in absolute CD4+ T cells per/year was calculated by linear regression. (A) The value of the slope is represented on the y-axis for subjects with HIV-1 RNA < 1 copy/ml (black circles) and HIV-1 RNA > or equal to 1 copy/ml (grey triangles). The median change in CD4+ T cell count per/year is indicated with horizontal black bars. The p value of the difference between the groups was calculated using a two-tailed Mann Whitney U test. (B) The proportion of individuals with stable CD4+ T cells/mm3 per year (shown in white bars) and with significant CD4+ T cell loss cells/mm3 per year (shown in black bars) is compared between subjects with HIV-1 RNA < 1 copy/ml and HIV-1 RNA equal or > to 1 copy/ml.
Similar articles
- Relationship between T cell activation and CD4+ T cell count in HIV-seropositive individuals with undetectable plasma HIV RNA levels in the absence of therapy.
Hunt PW, Brenchley J, Sinclair E, McCune JM, Roland M, Page-Shafer K, Hsue P, Emu B, Krone M, Lampiris H, Douek D, Martin JN, Deeks SG. Hunt PW, et al. J Infect Dis. 2008 Jan 1;197(1):126-33. doi: 10.1086/524143. J Infect Dis. 2008. PMID: 18171295 Free PMC article. - Evidence for persistent low-level viremia in individuals who control human immunodeficiency virus in the absence of antiretroviral therapy.
Hatano H, Delwart EL, Norris PJ, Lee TH, Dunn-Williams J, Hunt PW, Hoh R, Stramer SL, Linnen JM, McCune JM, Martin JN, Busch MP, Deeks SG. Hatano H, et al. J Virol. 2009 Jan;83(1):329-35. doi: 10.1128/JVI.01763-08. Epub 2008 Oct 22. J Virol. 2009. PMID: 18945778 Free PMC article. - Immune Activation and HIV-Specific CD8(+) T Cells in Cerebrospinal Fluid of HIV Controllers and Noncontrollers.
Ganesh A, Lemongello D, Lee E, Peterson J, McLaughlin BE, Ferre AL, Gillespie GM, Fuchs D, Deeks SG, Hunt PW, Price RW, Spudich SS, Shacklett BL. Ganesh A, et al. AIDS Res Hum Retroviruses. 2016 Aug;32(8):791-800. doi: 10.1089/AID.2015.0313. Epub 2016 May 2. AIDS Res Hum Retroviruses. 2016. PMID: 27019338 Free PMC article. - Low-level viremia in HIV-1 infection: consequences and implications for switching to a new regimen.
Cohen C. Cohen C. HIV Clin Trials. 2009 Mar-Apr;10(2):116-24. doi: 10.1310/hct1002-116. HIV Clin Trials. 2009. PMID: 19487182 Review. - HIV-specific CD4 T cells and immune control of viral replication.
Porichis F, Kaufmann DE. Porichis F, et al. Curr Opin HIV AIDS. 2011 May;6(3):174-80. doi: 10.1097/COH.0b013e3283454058. Curr Opin HIV AIDS. 2011. PMID: 21502921 Free PMC article. Review.
Cited by
- Success and failure of the cellular immune response against HIV-1.
Migueles SA, Connors M. Migueles SA, et al. Nat Immunol. 2015 Jun;16(6):563-70. doi: 10.1038/ni.3161. Nat Immunol. 2015. PMID: 25988888 Review. - Identification of antibody targets associated with lower HIV viral load and viremic control.
Grant-McAuley W, Morgenlander WR, Ruczinski I, Kammers K, Laeyendecker O, Hudelson SE, Thakar M, Piwowar-Manning E, Clarke W, Breaud A, Ayles H, Bock P, Moore A, Kosloff B, Shanaube K, Meehan SA, van Deventer A, Fidler S, Hayes R, Larman HB, Eshleman SH; HPTN 071 (PopART) Study Team. Grant-McAuley W, et al. PLoS One. 2024 Sep 17;19(9):e0305976. doi: 10.1371/journal.pone.0305976. eCollection 2024. PLoS One. 2024. PMID: 39288118 Free PMC article. Clinical Trial. - The Antibodiome-Mapping the Humoral Immune Response to HIV.
Butler AL, Fischinger S, Alter G. Butler AL, et al. Curr HIV/AIDS Rep. 2019 Apr;16(2):169-179. doi: 10.1007/s11904-019-00432-x. Curr HIV/AIDS Rep. 2019. PMID: 30903381 Free PMC article. Review. - Transcriptional profiling of CD4 T cells identifies distinct subgroups of HIV-1 elite controllers.
Vigneault F, Woods M, Buzon MJ, Li C, Pereyra F, Crosby SD, Rychert J, Church G, Martinez-Picado J, Rosenberg ES, Telenti A, Yu XG, Lichterfeld M. Vigneault F, et al. J Virol. 2011 Mar;85(6):3015-9. doi: 10.1128/JVI.01846-10. Epub 2010 Dec 22. J Virol. 2011. PMID: 21177805 Free PMC article. - Potential role for HIV-specific CD38-/HLA-DR+ CD8+ T cells in viral suppression and cytotoxicity in HIV controllers.
Hua S, Lécuroux C, Sáez-Cirión A, Pancino G, Girault I, Versmisse P, Boufassa F, Taulera O, Sinet M, Lambotte O, Venet A. Hua S, et al. PLoS One. 2014 Jul 7;9(7):e101920. doi: 10.1371/journal.pone.0101920. eCollection 2014. PLoS One. 2014. PMID: 25000587 Free PMC article.
References
- Robertson MDM, Fitzgerald D, Duerr A, Casimiro D, McElrath J, Lawrence D, Buchbinder Susan. Efficacy Results from the STEP Study (Merck V520 Protocol 023/HVTN 502): A Phase II Test-of-Concept Trial of the MRKAd5 HIV-1 Gag/Pol/Nef Trivalent Vaccine. Conference of Retroviruses and Opportunisitc Infections; Boston. 2008.
- Deeks SG, Walker BD. Human immunodeficiency virus controllers: mechanisms of durable virus control in the absence of antiretroviral therapy. Immunity. 2007;27:406–16. - PubMed
Publication types
MeSH terms
Substances
Grants and funding
- AI30914/AI/NIAID NIH HHS/United States
- R37 AI028568/AI/NIAID NIH HHS/United States
- AI28568/AI/NIAID NIH HHS/United States
- R01 AI030914/AI/NIAID NIH HHS/United States
- R01 AI028568/AI/NIAID NIH HHS/United States
- P30 AI060354/AI/NIAID NIH HHS/United States
LinkOut - more resources
Full Text Sources
Medical
Research Materials


