IRE1alpha kinase activation modes control alternate endoribonuclease outputs to determine divergent cell fates - PubMed (original) (raw)
IRE1alpha kinase activation modes control alternate endoribonuclease outputs to determine divergent cell fates
Dan Han et al. Cell. 2009.
Abstract
During endoplasmic reticulum (ER) stress, homeostatic signaling through the unfolded protein response (UPR) augments ER protein-folding capacity. If homeostasis is not restored, the UPR triggers apoptosis. We found that the ER transmembrane kinase/endoribonuclease (RNase) IRE1alpha is a key component of this apoptotic switch. ER stress induces IRE1alpha kinase autophosphorylation, activating the RNase to splice XBP1 mRNA and produce the homeostatic transcription factor XBP1s. Under ER stress--or forced autophosphorylation--IRE1alpha's RNase also causes endonucleolytic decay of many ER-localized mRNAs, including those encoding chaperones, as early events culminating in apoptosis. Using chemical genetics, we show that kinase inhibitors bypass autophosphorylation to activate the RNase by an alternate mode that enforces XBP1 splicing and averts mRNA decay and apoptosis. Alternate RNase activation by kinase-inhibited IRE1alpha can be reconstituted in vitro. We propose that divergent cell fates during ER stress hinge on a balance between IRE1alpha RNase outputs that can be tilted with kinase inhibitors to favor survival.
Figures
Figure 1. Conditional Tools to Forcibly Trigger IRE1α Catalytic Activities
(A) IRE1α mutants in this study, and the chemical structure of 1NM-PP1. (B) Anti-Myc immunoblot of IRE1α transgenic proteins induced in INS-1 stable lines with doxycycline (Dox). (C) Confocal fluorescence micrographs of INS-1 cells showing co-localization of eGFP-WT IRE1α and eGFP-IRE1α (I642G) with transiently transfected ER-DsRED. Time course immunoblots of transgenic IRE1α proteins induced with Dox in INS-1 cells (anti-Myc and anti-phospho IRE1α). (D) Anti-total and anti-phospho IRE1α immunoblots of WT IRE1α, I642G, and K907A proteins produced from constructs transfected into Ire1 α−/− MEFs, +/− 1NM-PP1. (E) Immunoprecipitation (i.p) of Myc-tagged IRE1α proteins from T-REx 293 cells. (F) in vitro autophosphorylation of i.p.-ed Myc-tagged IRE1α and mutants, +/−1NM-PP1.
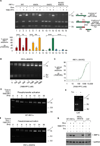
Figure 2. Two Distinct Modes to Produce XBP1s Transcription Factor
(A) EtBr-stained agarose gel of XBP1 cDNA amplicons after induction of IRE1α variants for 8 hrs, followed by 5µM 1NM-PP1 (or DMSO) for 4 hrs. The cDNA amplicon of unspliced XBP1 mRNA is cleaved by a PstI site within a 26 nucleotide intron to give 2U and 3U. IRE1α-mediated cleavage of the intron and re-ligation in vivo removes the PstI site to give the 1S (spliced) amplicon. *is a spliced/unspliced XBP1 hybrid amplicon. The ratio of spliced over (spliced + unspliced) amplicons—1S/(1S+2U+3U)—is reported as % spliced XBP1 amplicons in histograms. Three independent biological samples were used. Data are means +/− SD. P-values: ** <0.01 and *** <0.002. ns=not significant. (B) % spliced XBP1 amplicons in IRE1α (I642G)-expressing INS-1 cells as a function of [1NM-PP1]. (C) Curve fitting to triplicate 1NM-PP1 concentration-dependent splicing assays in IRE1α (I642G)-expressing T-REx 293 cells. (D) Time course of XBP1 mRNA splicing under “phosphotransfer activation”—defined as provision of Dox (0.1µg/ml) and 1NM-PP1 (5µM) to stable WT IRE1α-expressing cells. 1NM-PP1 is inert for WT IRE1α—Figure 2A, lane 3—but always added to maintain consistency with pseudokinase activation. (E) ER stress-mediated splicing of XBP1 mRNA in INS-1 CAT cells using tunicamycin—Tm—(5µg/ml) for 2 hrs. (F) Time course of XBP1 mRNA splicing under “pseudokinase activation”, defined as provision of Dox (0.1µg/ml) and 1NM-PP1 (5µM) to stable IRE1α (I642G)-expressing cells. Time courses shown used T-REx 293 cells and were identical in INS-1 cells (not shown). (G) Immunoblot of XBP1s transcription factor under phosphotransfer or pseudokinase activation in INS-1 cells, and INS-1 CAT cells under Tm.
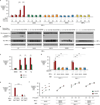
Figure 3. Divergent Cell Fates under Phosphotransfer and Pseudokinase Activation of IRE1α RNase
INS-1 cells under phosphotransfer or pseudokinase activation, activation of kinase-active/RNase-dead mutants K907A and N906A, and expression of XBP1s: (A) Time course of percent cells staining positive for Annexin V. (B) Time course immunoblots of full-length and cleaved caspase 3, and Myc-IRE1α proteins. NT=not treated (C) Percent Ire1 α−/− and Ire1 α+/+ MEFs staining positive for Annexin V during ER stress induced by brefeldin A (BFA) (0.5µg/mL), Tm (0.5µg/mL) or Tg (0.1µM). (D) Percent cells staining positive for Annexin V 24 hrs after transfection of expression vectors encoding WT IRE1α, I642G, K907A, or N906A into Ire1 α−/− or _Xbp1_−/− MEFs. 5µM 1NM-PP1 (or DMSO) was added at the time of transfection. (E) Percent cells staining positive for Annexin V 24 hrs after transfection of WT IRE1α expression vector (WT) or empty vector (vector) in _Bax_−/− _Bak_−/− MEFs. (F) Percent cells staining positive for Annexin V 24 hrs after provision of varying concentrations of Tm in Ire1 α−/− or _Xbp1_−/− MEFs. All cells were previously transfected with 1µg of expression vectors bearing WT, I642G, K907A, or N906A for 8 hrs, treated with 1NM-PP1 (or DMSO) overnight and then treated for 24 hrs with Tm. Data are means +/− SD. P-values: **<0.02 and ***<0.002. Figure S3 shows equivalent transgenic IRE1α protein levels. For all experiments, three independent biological samples were measured.
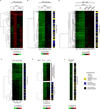
Figure 4. Gene Expression Profiling Reveals ER-localized mRNA Decay under IRE1α Phosphotransfer Activation and ER Stress
Hierarchical clustering analysis of gene expression changes from DNA microarrays. (A) Genes whose expression is 2-fold or more increased under either phosphotransfer activation or pseudokinase activation in T-REx 293 cells. (B) Genes whose expression is significantly reduced 2-fold or more at 8 hrs in phosphotransfer-activated T-REx 293 cells (vs. untreated) (q-value < 0.05), and significantly different between phosphotransfer activation and pseudokinase activation at 8 hrs (q-value<0.05). (C) Genes whose expression is significantly reduced 2-fold or more at 24 hrs in phosphotransfer-activated INS-1 cells (vs. untreated) (q-value < 0.05), and significantly different between phosphotransfer activation, pseudokinase activation, and phosphotransfer activation of the RNase-dead mutant N906A at 24 hrs (q-value < 0.05)— expression changes for these genes at 8 and 16 hrs under phosphotransfer activation and at 24 hrs in XBP1s-expressing cells are displayed in the same row (D) Genes that are significantly downregulated at 6 hrs under 1µM Tg in INS-1 CAT cells— expression changes for these genes at 2 and 4 hrs under 1µM Tg are displayed in the same row (q-value < 0.05). (E) Genes that are significantly reduced 2-fold or more under 1µM Tg in Ire1 α+/+ MEFs (q-value < 0.05), and significantly different between 1µM Tg-treated WT MEFs (vs. untreated) and 1µM Tg-treated Ire1 α−/− MEFs (vs. untreated) (q-value < 0.05). (F) Genes that are significantly reduced in normally growing Ins2 (C96Y) Akita cells compared to isogenic WT controls (q-value < 0.05). Annotation keys were used to divide the predicted function of down-regulated genes into SPR: Secretory-pathway ER-resident protein, SPC: Secretory-pathway client protein (cargo), or NSP: Non-secretory pathway protein. A set of IRE1α-dependent decreasing mRNAs encoding nuclear localized genes was noted in (E). Colorbars indicate upregulated genes in red, and downregulated genes in green (_log_2). For all experiments, the mean of three or four independent biological samples is shown. See Table S1–Table S6 for gene identities, _log_2 expression changes, and statistics.
Figure 5. Validation of Cargo and Chaperone mRNA/Protein Decay under IRE1α Phosphotransfer Activation or ER Stress
(A) Time course analysis of Ins1 mRNA expression (normalized to GAPDH) during ER stress (1µM Tg), WT IRE1α, I642G, or N906A activation in INS-1 cells by quantitative real-time PCR (Q-PCR). (B) Immunoblot of proinsulin during ER stress (1µM Tg), WT IRE1α, I642G, or N906A activation in INS-1 cells. (C) Time course analysis of the expression of mRNAs encoding ER-resident activities—Pdia4, Gyltl1b, Rtn4, Galnt2—during WT IRE1α, I642G, or N906A activation in INS-1 cells by Q-PCR. (D) Time course analysis of BiP or Gyltl1b mRNA levels during ER stress (1µM Tg) by Q-PCR. To attenuate transcription, cells were pretreated with 5 µg/mL Actinomycin D (or DMSO) for 1 hr, then left untreated or treated for the indicated times with 1µM Tg. (E) Anti-IRE1α immunoblot of INS-1 CAT cells electroporated with IRE1α siRNA or scramble siRNA control (SCR). (F) Baseline XBP1 mRNA splicing in Akita and isogenic WT cells (ct14). Q-PCR analysis of Ins1 or ERdj5 mRNA levels in Akita and ct14 cells. Immunoblot analysis of ERdj5 and proinsulin in Akita and ct14 cells. Annexin V positive staining in Akita and ct14 cells. Three independent biological samples were used for Q-PCR and XBP1 splicing experiments. Data are means +/− SD. P-values: ** <0.02 and *** <0.005.
Figure 6. Reconstitution of Insulin RNA Cleavage by IRE1α in vitro
(A) In vitro cleavage of a 352 nucleotide (nt) XBP1 RNA encompassing the 26-nt intron, and a full-length 503-nt mouse Ins2 RNA by immunoprecipitated (i.p.) WT IRE1α and I642G proteins from T-REx 293 cells. ϕ=substrate alone; CAT=mock i.p. from T-REx 293 CAT cells. (B) Control reactions using kinase-active RNase-dead IRE1α (N906A) mutant. Anti-Myc immunoblot analysis show amounts of immunoprecipitated proteins used for in vitro cleavage reactions. (C) In vitro cleavage of 5’FAM -3’BHQ labeled XBP1 single stem-loop mini-substrate by WT IRE1α or I642G proteins +/− 1NM-PP1. ϕ=substrate alone; CAT= mock i.p. from T-REx 293 CAT cells. (D) Mapping of IRE1α cleavage sites in mouse Ins2 RNA, and sequence alignment with the cleavage sites of mouse XBP1 and rat Ins1 shows conservation. An asterisk * indicates complete nucleotide conservation, whereas ● indicates 4 out of 5 conserved nucleotides. See Figure S13 for cleavage site mapping of rat Ins1 RNA.
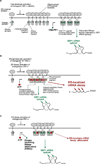
Figure 7. Model For Divergent IRE1α RNase Outputs and their Modulation by Kinase Inhibitors
(A) Pseudokinase IRE1α activation. Overproduction of IRE1α (I642G) causes it to cluster in the ER, allowing 1NM-PP1 to allosterically activate the RNase when it binds the engineered kinase pocket. While these two steps are depicted as separable, when provided 1NM-PP1 during IRE1α (I642G) overproduction, XBP1 mRNA splicing is identical to that occurring during overproduction of WT IRE1α—the phosphotransfer activation mode, (B). Oligomerization of the kinase/RNase domains in phosphorylated IRE1α is depicted as higher-order than in IRE1α (I642G) under 1NM-PP1. Relaxed specificity of the RNase pocket in phosphorylated IRE1α promotes ER-localized mRNA decay. IRE1α (I642G) under 1NM-PP1 is maintained in a tight conformation that restricts activity to XBP1 splicing, thus averting ER mRNA decay, (A). (C) KIRAs: kinase-inhibiting RNase attenuators of IRE1α. KIRAs reduce IRE1α autophosphorylation, thus reducing kinase/RNase oligomerization and tempering ER-localized mRNA decay; KIRAs permit, and even enhance XBP1 mRNA splicing, because they still satisfy the kinase ligand requirement in endogenous IRE1α.
Similar articles
- ER stress and distinct outputs of the IRE1α RNase control proliferation and senescence in response to oncogenic Ras.
Blazanin N, Son J, Craig-Lucas AB, John CL, Breech KJ, Podolsky MA, Glick AB. Blazanin N, et al. Proc Natl Acad Sci U S A. 2017 Sep 12;114(37):9900-9905. doi: 10.1073/pnas.1701757114. Epub 2017 Aug 28. Proc Natl Acad Sci U S A. 2017. PMID: 28847931 Free PMC article. - Allosteric inhibition of the IRE1α RNase preserves cell viability and function during endoplasmic reticulum stress.
Ghosh R, Wang L, Wang ES, Perera BG, Igbaria A, Morita S, Prado K, Thamsen M, Caswell D, Macias H, Weiberth KF, Gliedt MJ, Alavi MV, Hari SB, Mitra AK, Bhhatarai B, Schürer SC, Snapp EL, Gould DB, German MS, Backes BJ, Maly DJ, Oakes SA, Papa FR. Ghosh R, et al. Cell. 2014 Jul 31;158(3):534-48. doi: 10.1016/j.cell.2014.07.002. Epub 2014 Jul 10. Cell. 2014. PMID: 25018104 Free PMC article. - Divergent allosteric control of the IRE1α endoribonuclease using kinase inhibitors.
Wang L, Perera BG, Hari SB, Bhhatarai B, Backes BJ, Seeliger MA, Schürer SC, Oakes SA, Papa FR, Maly DJ. Wang L, et al. Nat Chem Biol. 2012 Dec;8(12):982-9. doi: 10.1038/nchembio.1094. Epub 2012 Oct 21. Nat Chem Biol. 2012. PMID: 23086298 Free PMC article. - The multiple roles of the unfolded protein response regulator IRE1α in cancer.
Chalmers F, Mogre S, Son J, Blazanin N, Glick AB. Chalmers F, et al. Mol Carcinog. 2019 Sep;58(9):1623-1630. doi: 10.1002/mc.23031. Epub 2019 Apr 30. Mol Carcinog. 2019. PMID: 31041814 Free PMC article. Review. - The unknown face of IRE1α - Beyond ER stress.
Abdullah A, Ravanan P. Abdullah A, et al. Eur J Cell Biol. 2018 Jun;97(5):359-368. doi: 10.1016/j.ejcb.2018.05.002. Epub 2018 May 4. Eur J Cell Biol. 2018. PMID: 29747876 Review.
Cited by
- Oxidative stress, unfolded protein response, and apoptosis in developmental toxicity.
Kupsco A, Schlenk D. Kupsco A, et al. Int Rev Cell Mol Biol. 2015;317:1-66. doi: 10.1016/bs.ircmb.2015.02.002. Epub 2015 Mar 11. Int Rev Cell Mol Biol. 2015. PMID: 26008783 Free PMC article. Review. - IRE1 RNase controls CD95-mediated cell death.
Pelizzari-Raymundo D, Maltret V, Nivet M, Pineau R, Papaioannou A, Zhou X, Caradec F, Martin S, Le Gallo M, Avril T, Chevet E, Lafont E. Pelizzari-Raymundo D, et al. EMBO Rep. 2024 Apr;25(4):1792-1813. doi: 10.1038/s44319-024-00095-9. Epub 2024 Feb 21. EMBO Rep. 2024. PMID: 38383861 Free PMC article. - ER stress-induced cell death mechanisms.
Sano R, Reed JC. Sano R, et al. Biochim Biophys Acta. 2013 Dec;1833(12):3460-3470. doi: 10.1016/j.bbamcr.2013.06.028. Epub 2013 Jul 10. Biochim Biophys Acta. 2013. PMID: 23850759 Free PMC article. Review. - Dialogue between mitochondria and endoplasmic reticulum-potential therapeutic targets for age-related cardiovascular diseases.
Chen C, Dong X, Zhang W, Chang X, Gao W. Chen C, et al. Front Pharmacol. 2024 Jun 13;15:1389202. doi: 10.3389/fphar.2024.1389202. eCollection 2024. Front Pharmacol. 2024. PMID: 38939842 Free PMC article. Review. - Regulation of cytoplasmic mRNA decay.
Schoenberg DR, Maquat LE. Schoenberg DR, et al. Nat Rev Genet. 2012 Mar 6;13(4):246-59. doi: 10.1038/nrg3160. Nat Rev Genet. 2012. PMID: 22392217 Free PMC article. Review.
References
- Boudeau J, Miranda-Saavedra D, Barton GJ, Alessi DR. Emerging roles of pseudokinases. Trends Cell Biol. 2006;16:443–452. - PubMed
- Calfon M, Zeng H, Urano F, Till JH, Hubbard SR, Harding HP, Clark SG, Ron D. IRE1 couples endoplasmic reticulum load to secretory capacity by processing the XBP-1 mRNA. Nature. 2002;415:92–96. - PubMed
- Han D, Upton JP, Hagen A, Callahan J, Oakes SA, Papa FR. A kinase inhibitor activates the IRE1alpha RNase to confer cytoprotection against ER stress. Biochem Biophys Res Commun. 2008;365:777–783. - PubMed
Publication types
MeSH terms
Substances
Grants and funding
- K08 DK065671-05/DK/NIDDK NIH HHS/United States
- HHMI/Howard Hughes Medical Institute/United States
- R01 DK080955-01A1/DK/NIDDK NIH HHS/United States
- K08 DK065671/DK/NIDDK NIH HHS/United States
- DP2 OD001925-01/OD/NIH HHS/United States
- DP2 OD001925/OD/NIH HHS/United States
- R25 GM56847/GM/NIGMS NIH HHS/United States
- R25 GM056847/GM/NIGMS NIH HHS/United States
- R01 CA136577/CA/NCI NIH HHS/United States
- R01CA136577/CA/NCI NIH HHS/United States
- K08 AI054650/AI/NIAID NIH HHS/United States
- R01 DK080955/DK/NIDDK NIH HHS/United States
LinkOut - more resources
Full Text Sources
Other Literature Sources


