Single-molecule sequencing of an individual human genome - PubMed (original) (raw)
Single-molecule sequencing of an individual human genome
Dmitry Pushkarev et al. Nat Biotechnol. 2009 Sep.
Abstract
Recent advances in high-throughput DNA sequencing technologies have enabled order-of-magnitude improvements in both cost and throughput. Here we report the use of single-molecule methods to sequence an individual human genome. We aligned billions of 24- to 70-bp reads (32 bp average) to approximately 90% of the National Center for Biotechnology Information (NCBI) reference genome, with 28x average coverage. Our results were obtained on one sequencing instrument by a single operator with four data collection runs. Single-molecule sequencing enabled analysis of human genomic information without the need for cloning, amplification or ligation. We determined approximately 2.8 million single nucleotide polymorphisms (SNPs) with a false-positive rate of less than 1% as validated by Sanger sequencing and 99.8% concordance with SNP genotyping arrays. We identified 752 regions of copy number variation by analyzing coverage depth alone and validated 27 of these using digital PCR. This milestone should allow widespread application of genome sequencing to many aspects of genetics and human health, including personal genomics.
Figures
Figure 1
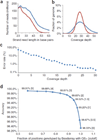
P0 genome sequencing metrics. (a) Read length distributions for raw reads (blue) and uniquely aligned reads (red) from Helicos single-molecule sequencing of the genome of Patient Zero (P0). Filtered reads tend to be shorter because a larger proportion of the long reads are instrument artifacts related to the base addition order. (b) Coverage depth for sequence data of the P0 genome, computed over repeat masked regions (ENSEMBL, blue) compared to theoretical Poisson limit (red). (c) Error rate as a function of sequence coverage depth. Above 30× coverage, sampling noise from the limited number of BeadArray results begins to dominate the error rate, and error rate measurements are not accurate. Error rates are defined as concordance with independent measurement of SNPs using the Illumina Human610-Quad SNP BeadArray (see Online Methods for details). (d) Quality score (QS) tradeoffs between sensitivity and accuracy. High sensitivity is obtained by using a QS threshold of 0, which results in calls for all comparison BeadArray locations, with an accuracy of 98.3%. Raising the QS threshold to 1 results in 97% of comparison BeadArray locations being called, thereby lowering the sensitivity but increasing the accuracy of those calls to 99.2%. Numbers next to each data point indicate accuracy (percentages) and cutoff score (in brackets).
Figure 2
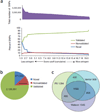
SNP discovery in P0. (a) SNP distribution in the P0 genome as a function of quality score. Putative SNPs are ‘validated’ or ‘nonvalidated’ if they are annotated as such in dbSNP. Putative SNPs not found in dbSNP are ‘novel’. SNPs with larger quality scores are called with higher confidence. A substantial decrease in the proportion of validated SNPs is seen as the quality score drops below 2.8, suggesting that 2.8 is a reasonable threshold for identifying high quality SNPs. (b) Distribution of high-quality SNP calls (quality score >2.8) for the P0 human genome. Validated, nonvalidated and novel SNPs are defined as in a. (c) Overlap in SNP locations between the genomes of P0, James Watson and Craig Venter (in thousands). In this figure the quality-score cutoff was moved to the second plateau in a (QS >1.9), increasing the sensitivity and resulting in a total of 3,263,470 SNPs in the P0 genome. This is due to a further 389,736 novel SNPs, 18,495 unvalidated SNPs and 49,768 validated SNPs. The ratio of validated to novel SNPs can be used to estimate that this improvement in sensitivity comes at a cost of an increased overall false-positive rate (from 1% to 10%). Even with this less restrictive cutoff, the SNP proportions shared with Venter and Watson remain consistent.
Figure 3
Copy number variation in the P0 human genome. Blue, signal from simulated dataset (simulated reads per 1 kb bin). Magenta, CNV estimate. Green, raw signal (actual reads mapped per 1 kb bin). (a) Heterozygous deletion. (b) Homozygous deletion. (c) Homozygous duplication. (d) Heterozygous deletion.
Comment in
- DNA confidential.
[No authors listed] [No authors listed] Nat Biotechnol. 2009 Sep;27(9):777. doi: 10.1038/nbt0909-777. Nat Biotechnol. 2009. PMID: 19741610
Similar articles
- The complete genome of an individual by massively parallel DNA sequencing.
Wheeler DA, Srinivasan M, Egholm M, Shen Y, Chen L, McGuire A, He W, Chen YJ, Makhijani V, Roth GT, Gomes X, Tartaro K, Niazi F, Turcotte CL, Irzyk GP, Lupski JR, Chinault C, Song XZ, Liu Y, Yuan Y, Nazareth L, Qin X, Muzny DM, Margulies M, Weinstock GM, Gibbs RA, Rothberg JM. Wheeler DA, et al. Nature. 2008 Apr 17;452(7189):872-6. doi: 10.1038/nature06884. Nature. 2008. PMID: 18421352 - Accurate detection and genotyping of SNPs utilizing population sequencing data.
Bansal V, Harismendy O, Tewhey R, Murray SS, Schork NJ, Topol EJ, Frazer KA. Bansal V, et al. Genome Res. 2010 Apr;20(4):537-45. doi: 10.1101/gr.100040.109. Epub 2010 Feb 11. Genome Res. 2010. PMID: 20150320 Free PMC article. - Large scale single nucleotide polymorphism discovery in unsequenced genomes using second generation high throughput sequencing technology: applied to turkey.
Kerstens HH, Crooijmans RP, Veenendaal A, Dibbits BW, Chin-A-Woeng TF, den Dunnen JT, Groenen MA. Kerstens HH, et al. BMC Genomics. 2009 Oct 16;10:479. doi: 10.1186/1471-2164-10-479. BMC Genomics. 2009. PMID: 19835600 Free PMC article. - Genome Wide Sampling Sequencing for SNP Genotyping: Methods, Challenges and Future Development.
Jiang Z, Wang H, Michal JJ, Zhou X, Liu B, Woods LC, Fuchs RA. Jiang Z, et al. Int J Biol Sci. 2016 Jan 1;12(1):100-8. doi: 10.7150/ijbs.13498. eCollection 2016. Int J Biol Sci. 2016. PMID: 26722221 Free PMC article. Review. - Whole genome sequencing.
Ng PC, Kirkness EF. Ng PC, et al. Methods Mol Biol. 2010;628:215-26. doi: 10.1007/978-1-60327-367-1_12. Methods Mol Biol. 2010. PMID: 20238084 Review.
Cited by
- Determination of haplotypes at structurally complex regions using emulsion haplotype fusion PCR.
Tyson J, Armour JA. Tyson J, et al. BMC Genomics. 2012 Dec 11;13:693. doi: 10.1186/1471-2164-13-693. BMC Genomics. 2012. PMID: 23231411 Free PMC article. - Computational Methods and Correlation of Exon-skipping Events with Splicing, Transcription, and Epigenetic Factors.
Wang J, Ye Z, Huang TH, Shi H, Jin VX. Wang J, et al. Methods Mol Biol. 2017;1513:163-170. doi: 10.1007/978-1-4939-6539-7_11. Methods Mol Biol. 2017. PMID: 27807836 Free PMC article. - Single molecule sequencing with a HeliScope genetic analysis system.
Thompson JF, Steinmann KE. Thompson JF, et al. Curr Protoc Mol Biol. 2010 Oct;Chapter 7:Unit7.10. doi: 10.1002/0471142727.mb0710s92. Curr Protoc Mol Biol. 2010. PMID: 20890904 Free PMC article. - Simultaneous alignment of short reads against multiple genomes.
Schneeberger K, Hagmann J, Ossowski S, Warthmann N, Gesing S, Kohlbacher O, Weigel D. Schneeberger K, et al. Genome Biol. 2009;10(9):R98. doi: 10.1186/gb-2009-10-9-r98. Epub 2009 Sep 17. Genome Biol. 2009. PMID: 19761611 Free PMC article. - Assessment of genetic variation for the LINE-1 retrotransposon from next generation sequence data.
Rouchka E, Montoya-Durango DE, Stribinskis V, Ramos K, Kalbfleisch T. Rouchka E, et al. BMC Bioinformatics. 2010 Oct 28;11 Suppl 9(Suppl 9):S12. doi: 10.1186/1471-2105-11-S9-S12. BMC Bioinformatics. 2010. PMID: 21044359 Free PMC article.
References
- Venter JC, et al. The sequence of the human genome. Science. 2001;291:1304–1351. - PubMed
- Lander ES, et al. Initial sequencing and analysis of the human genome. Nature. 2001;409:860–921. - PubMed
- Wheeler DA, et al. The complete genome of an individual by massively parallel DNA sequencing. Nature. 2008;452:872–876. - PubMed
Publication types
MeSH terms
LinkOut - more resources
Full Text Sources
Other Literature Sources


