Promoter-wide analysis of Smad4 binding sites in human epithelial cells - PubMed (original) (raw)
Promoter-wide analysis of Smad4 binding sites in human epithelial cells
Daizo Koinuma et al. Cancer Sci. 2009 Nov.
Abstract
Smad4, the common partner Smad, is a key molecule in transforming growth factor-beta (TGF-beta) family signaling. Loss of Smad4 expression is found in several types of cancer, including pancreatic cancer and colon cancer, and is related to carcinogenesis. Here we identified Smad4 binding sites in the promoter regions of over 25 500 known genes by chromatin immunoprecipitation on a microarray (ChIP-chip) in HaCaT human keratinocytes. We identified 925 significant Smad4 binding sites. Approximately half of the identified sites overlapped the binding regions of Smad2 and Smad3 (Smad2/3, receptor-regulated Smads in TGF-beta signaling), while the rest of the regions appeared dominantly occupied by Smad4 even when a different identification threshold for Smad2/3 binding regions was used. Distribution analysis showed that Smad4 was found in the regions relatively distant from the transcription start sites, while Smad2/3 binding regions were more often present near the transcription start sites. Motif analysis also revealed that activator protein 1 (AP-1) sites were especially enriched in the sites common to Smad2/3 and Smad4 binding regions. In contrast, GC-rich motifs were enriched in Smad4-dominant binding regions. We further determined putative target genes of Smad4 whose expression was regulated by TGF-beta. Our findings revealed some general characteristics of Smad4 binding regions, and provide resources for examining the role of Smad4 in epithelial cells and cancer pathogenesis.
Figures
Figure 1
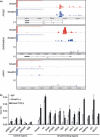
Validation of identified Smad4 binding regions. (a) Examples of the obtained chromatin immunoprecipitation on a microarray (ChIP‐chip) signals. Probe signals were transformed to MAT scores for each position, and significant Smad4 binding regions were determined and are shown in red bars. For comparison, Smad2/3 binding signals and significant binding regions( 10 ) are shown in blue. –, RefSeq genes located on the minus strand; +, RefSeq genes located on the plus strand. (b) HaCaT cells were treated with 120 p
m
of transforming growth factor (TGF)‐β for 1.5 h, fixed, and harvested. Smad4‐bound DNA was quantified by real‐time PCR. Values are presented as percentages of Smad4 ChIPs compared to input genome. Control regions were the regions where no significant Smad4 ChIP‐signals were observed. IgG, control IgG; –, without TGF‐β treatment. p53‐1 and p53‐2 represent two identified Smad4 binding regions near the p53 genes. Error bars represent standard errors (SE).
Figure 2
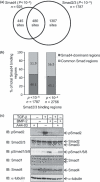
Smad4 binding regions are partially common to Smad2/3 binding regions. (a) Venn diagrams of Smad4 and Smad2/3 binding regions. A total of 925 Smad4 binding regions were determined by the cut‐off threshold of P <10−4. Smad4 binding regions common to Smad2/3 binding regions (cut‐off threshold of P <10−5) by at least one base pair were determined. (b) Overlapping regions were mostly unchanged by alteration of the cut‐off threshold of Smad2/3 binding regions. Smad2/3 binding regions are determined by the cut‐off threshold of either P <10−4 or P <10−5, and overlaps with Smad4 binding regions were determined as in (a). Data are represented as percentages of the total Smad4 binding regions. (c) Steady‐state phosphorylation of Smad1/5/8 was weakly up‐regulated by transforming growth factor (TGF)‐β under chromatin immunoprecipitation on a microarray (ChIP‐chip) conditions. HaCaT cells were stimulated with 120 p
m
TGF‐β or 200 ng/mL bone morphogenetic protein (BMP)‐2 for 1.5 h, or with 3 μ
m
of a kinase inhibitor of TGF‐β type I receptor A44‐03 for 3 h. Cell lysates were quantified for protein concentration, and samples with 70‐μg protein were applied in each lane. pSmad2, phosphorylated Smad2; pSmad1/5/8, phosphorylated Smad1/5/8.
Figure 3
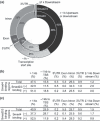
Distribution of Smad4 binding regions. (a) Smad4 binding regions are located in regions distant from the transcription start sites of known genes. Distribution of the Smad4 and Smad2/3 binding regions was determined by CEAS (cis‐regulatory element annotation system). (b) Differences in distribution of the Smad4 binding regions between the common regions and Smad4‐dominant regions. Distribution of the regions was determined as in (a). (c) Differences in distribution of the Smad2/3 binding regions between the common regions and Smad2/3‐only regions.
Figure 4
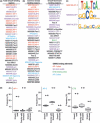
Identification of activator protein 1 (AP‐1) and GC‐rich sites as Smad4 binding regions. The DNA sequence within 250 bp from the peak position of each Smad4 binding region was analyzed by CEAS (cis‐regulatory element annotation system). Up to 36 enriched motifs are shown in the order of their significance. There were many matrices defined for the same transcription factors, and AP‐1, E26 transformation‐specific (ETS), AP‐2, and GC‐rich motifs are categorized and colored in red, green, blue, and purple, respectively. The Smad binding element (M00792.SMAD) is shown in bold characters. (a) Both AP‐1 and GC‐rich sites were enriched in the total Smad4 binding regions. (b, left) AP‐1 and GC‐rich sites were significantly enriched in the common Smad binding regions. (b, right) GC‐rich sites were enriched in Smad4‐dominant sites. (c) Schematic representation of the significantly enriched motifs in Smad4 binding regions. (d) Boxplot presentations of the frequencies of AP‐1, AP‐2, and ETS motifs in Smad4 binding regions and their control sequences. Frequencies of AP‐1, AP‐2, and ETS sites within 250 bp of the peak position of Smad4 binding regions and their shuffled sequences were determined using a pattern‐based identification approach. Outliers are plotted as filled circles. The outliers indicated by arrows show frequencies of the motifs in Smad4 binding regions.
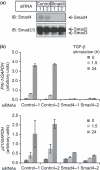
Figure 5
Effect of Smad4 siRNAs on expression of target genes. (a) Knock‐down of Smad4 by siRNAs. HaCaT cells were transfected with Smad4 or control siRNAs. Cells were then stimulated with 120‐p
m
transforming growth factor (TGF)‐β for 3 h, and harvested. Expression levels of endogenous Smad4 and Smad2/3 proteins were determined by immunoblotting. (b) HaCaT cells were transfected with siRNAs as indicated, and 48 h later stimulated with TGF‐β for the indicated times. Expression levels of plasminogen activator inhibitor type 1 (PAI‐1) and p21 mRNAs were determined by RT‐qPCR and normalized by the expression of GAPDH. Error bars indicate SD.
Similar articles
- Chromatin immunoprecipitation on microarray analysis of Smad2/3 binding sites reveals roles of ETS1 and TFAP2A in transforming growth factor beta signaling.
Koinuma D, Tsutsumi S, Kamimura N, Taniguchi H, Miyazawa K, Sunamura M, Imamura T, Miyazono K, Aburatani H. Koinuma D, et al. Mol Cell Biol. 2009 Jan;29(1):172-86. doi: 10.1128/MCB.01038-08. Epub 2008 Oct 27. Mol Cell Biol. 2009. PMID: 18955504 Free PMC article. - Identification of the gene transcription and apoptosis mediated by TGF-beta-Smad2/3-Smad4 signaling.
Yu J, Zhang L, Chen A, Xiang G, Wang Y, Wu J, Mitchelson K, Cheng J, Zhou Y. Yu J, et al. J Cell Physiol. 2008 May;215(2):422-33. doi: 10.1002/jcp.21325. J Cell Physiol. 2008. PMID: 17960585 - Smad signaling pathway is a pivotal component of tissue inhibitor of metalloproteinases-3 regulation by transforming growth factor beta in human chondrocytes.
Qureshi HY, Ricci G, Zafarullah M. Qureshi HY, et al. Biochim Biophys Acta. 2008 Sep;1783(9):1605-12. doi: 10.1016/j.bbamcr.2008.04.005. Epub 2008 Apr 18. Biochim Biophys Acta. 2008. PMID: 18471442 - The transforming growth factor-beta/SMAD signaling pathway is present and functional in human mesangial cells.
Poncelet AC, de Caestecker MP, Schnaper HW. Poncelet AC, et al. Kidney Int. 1999 Oct;56(4):1354-65. doi: 10.1046/j.1523-1755.1999.00680.x. Kidney Int. 1999. PMID: 10504488 - Cooperation between GATA4 and TGF-beta signaling regulates intestinal epithelial gene expression.
Belaguli NS, Zhang M, Rigi M, Aftab M, Berger DH. Belaguli NS, et al. Am J Physiol Gastrointest Liver Physiol. 2007 Jun;292(6):G1520-33. doi: 10.1152/ajpgi.00236.2006. Epub 2007 Feb 8. Am J Physiol Gastrointest Liver Physiol. 2007. PMID: 17290010
Cited by
- Genome-wide mechanisms of Smad binding.
Morikawa M, Koinuma D, Miyazono K, Heldin CH. Morikawa M, et al. Oncogene. 2013 Mar 28;32(13):1609-15. doi: 10.1038/onc.2012.191. Epub 2012 May 21. Oncogene. 2013. PMID: 22614010 Free PMC article. Review. - A pan-cancer analysis reveals nonstop extension mutations causing SMAD4 tumour suppressor degradation.
Dhamija S, Yang CM, Seiler J, Myacheva K, Caudron-Herger M, Wieland A, Abdelkarim M, Sharma Y, Riester M, Groß M, Maurer J, Diederichs S. Dhamija S, et al. Nat Cell Biol. 2020 Aug;22(8):999-1010. doi: 10.1038/s41556-020-0551-7. Epub 2020 Jul 27. Nat Cell Biol. 2020. PMID: 32719554 - Epithelial-intrinsic defects in TGFβR signaling drive local allergic inflammation manifesting as eosinophilic esophagitis.
Laky K, Kinard JL, Li JM, Moore IN, Lack J, Fischer ER, Kabat J, Latanich R, Zachos NC, Limkar AR, Weissler KA, Thompson RW, Wynn TA, Dietz HC, Guerrerio AL, Frischmeyer-Guerrerio PA. Laky K, et al. Sci Immunol. 2023 Jan 6;8(79):eabp9940. doi: 10.1126/sciimmunol.abp9940. Epub 2023 Jan 6. Sci Immunol. 2023. PMID: 36608150 Free PMC article. - The proto-oncogenic protein TAL1 controls TGF-β1 signaling through interaction with SMAD3.
Terme JM, Lemaire S, Auboeuf D, Mocquet V, Jalinot P. Terme JM, et al. Biochim Open. 2016 May 14;2:69-78. doi: 10.1016/j.biopen.2016.05.001. eCollection 2016 Jun. Biochim Open. 2016. PMID: 29632840 Free PMC article. - Transcriptional Control by the SMADs.
Hill CS. Hill CS. Cold Spring Harb Perspect Biol. 2016 Oct 3;8(10):a022079. doi: 10.1101/cshperspect.a022079. Cold Spring Harb Perspect Biol. 2016. PMID: 27449814 Free PMC article. Review.
References
- Heldin CH, Miyazono K, Ten Dijke P. TGF‐β signalling from cell membrane to nucleus through SMAD proteins. Nature 1997; 390: 465–71. - PubMed
- Shi Y, Massague J. Mechanisms of TGF‐β signaling from cell membrane to the nucleus. Cell 2003; 113: 685–700. - PubMed
- Derynck R, Akhurst RJ, Balmain A. TGF‐β signaling in tumor suppression and cancer progression. Nat Genet 2001; 29: 117–29. - PubMed
- Levy L, Hill CS. Alterations in components of the TGF‐β superfamily signaling pathways in human cancer. Cytokine Growth Factor Rev 2006; 17: 41–58. - PubMed
Publication types
MeSH terms
Substances
LinkOut - more resources
Full Text Sources
Research Materials
Miscellaneous
