Chromatin architecture and transcription factor binding regulate expression of erythrocyte membrane protein genes - PubMed (original) (raw)
Chromatin architecture and transcription factor binding regulate expression of erythrocyte membrane protein genes
Laurie A Steiner et al. Mol Cell Biol. 2009 Oct.
Abstract
Erythrocyte membrane protein genes serve as excellent models of complex gene locus structure and function, but their study has been complicated by both their large size and their complexity. To begin to understand the intricate interplay of transcription, dynamic chromatin architecture, transcription factor binding, and genomic organization in regulation of erythrocyte membrane protein genes, we performed chromatin immunoprecipitation (ChIP) coupled with microarray analysis and ChIP coupled with massively parallel DNA sequencing in both erythroid and nonerythroid cells. Unexpectedly, most regions of GATA-1 and NF-E2 binding were remote from gene promoters and transcriptional start sites, located primarily in introns. Cooccupancy with FOG-1, SCL, and MTA-2 was found at all regions of GATA-1 binding, with cooccupancy of SCL and MTA-2 also found at regions of NF-E2 binding. Cooccupancy of GATA-1 and NF-E2 was found frequently. A common signature of histone H3 trimethylation at lysine 4, GATA-1, NF-E2, FOG-1, SCL, and MTA-2 binding and consensus GATA-1-E-box binding motifs located 34 to 90 bp away from NF-E2 binding motifs was found frequently in erythroid cell-expressed genes. These results provide insights into our understanding of membrane protein gene regulation in erythropoiesis and the regulation of complex genetic loci in erythroid and nonerythroid cells and identify numerous candidate regions for mutations associated with membrane-linked hemolytic anemia.
Figures
FIG. 1.
Expression of major erythrocyte membrane genes. Reverse transcription-PCR was used to demonstrate mRNA expression levels of the 15 major erythrocyte membrane protein genes in erythroid- and nonerythroid-cell mRNA. Black bars represent mRNA expression in HeLa cells. Gray bars represent mRNA expression in K562 cells. White bars represent mRNA expression in primary, cultured erythroid cells. A region from the cerebellum-specific GABRA6 gene was included as a negative control.
FIG. 2.
Representative integrated genome browser (IGB) views of RNAPII, H3Me3K4, GATA-1, and NF-E2 binding at the 5′ end of the α-spectrin gene (A to C) and the ERMAP gene locus (D to F). (A) IGB view of RNAPII binding at the 5′ end of the α-spectrin promoter in erythroid (K562) and nonerythroid (HeLa) cells. There is a peak of RNAPII binding at the TSS of the α-spectrin gene in K562 cells but not in HeLa cells, demonstrating cell type-specific binding of RNAPII. (B) IGB view of H3Me3K4 binding at the 5′ end of the α-spectrin gene in erythroid (K562) and nonerythroid (HeLa) cells. There is a peak of H3Me3K4 binding in K562 cells but not in HeLa cells, demonstrating cell type-specific enrichment for H3Me3K4. (C) IGB view of GATA-1 and NF-E2 binding at the 5′ end of the α-spectrin gene, demonstrating NF-E2 binding at the promoter and GATA-1 binding in intron 3. (D) IGB view of RNAPII binding at the ERMAP locus in erythroid (K562) and nonerythroid (HeLa) cells. Two ERMAP isoforms are shown. There is a peak of RNAPII at the TSS in both K562 and HeLa cells for one isoform and a peak of RNAPII in K562 cells only for the alternate isoform, demonstrating cell type-specific binding of RNAPII. (E) IGB view of H3Me3K4 binding at the ERMAP locus in erythroid (K562) and nonerythroid (HeLa) cells. The ERMAP isoform with the erythroid cell-specific RNAPII binding has greater enrichment for H3Me3K4 in K562 cells than in HeLa cells, demonstrating cell type-specific enrichment of H3Me3K4. (F) IGB view of GATA-1 and NF-E2 binding at the ERMAP locus, demonstrating NF-E2 binding at the promoter, in intron 1, and at the 3′ adjacent region and GATA-1 binding in intron 1 and at the 3′ adjacent region of the ERMAP locus.
FIG. 3.
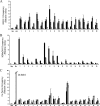
Quantitative ChIP analyses of regions of GATA-1 occupancy in erythrocyte membrane protein genes. Data are presented as enrichment (_n_-fold) relative to total input. A region from HS2 of the β-globin LCR was included as a positive control (Pos), and a region from the cerebellum-specific GABRA6 gene was included as a negative control (Neg). (A) Validation of regions of GATA-1 occupancy in the 15 erythrocyte membrane protein genes. ChIP analyses of the 19 regions of GATA-1 occupancy in K562 and primary erythroid cell chromatin predicted by the Tamalpais peak calling algorithm were performed using antibodies against GATA-1. Black bars represent GATA1-precipitated K562 cell chromatin. Gray bars represent GATA1-precipitated primary erythroid cell chromatin. White bars represent IgG-precipitated K562 chromatin. (B) H3Me3K4 occupancy in regions of GATA-1 binding in K562 and HeLa chromatin. ChIP analyses of H3Me3K4 occupancy in regions of GATA-1 binding in K562 and HeLa cell chromatin were performed using an antibody against H3Me3K4. Black bars represent H3Me3K4-immunoprecipitated K562 chromatin. Gray bars represent H3Me3K4-immunoprecipitated HeLa chromatin. White bars represent IgG-precipitated K562 chromatin. (C) Factor cooccupancy at sites of GATA-1 binding. ChIP analyses of the 19 regions of GATA-1 occupancy in K562 cell chromatin were performed using antibodies against FOG-1, SCL, and MTA-2. FOG-1, SCL, and MTA-2 binding are present in all regions of GATA-1 occupancy. Black bars represent FOG1-precipitated K562 cell chromatin. Gray bars represent MTA-2-precipitated K562 chromatin. Speckled bars represent SCL-precipitated K562 chromatin. White bars represent IgG-precipitated K562 chromatin.
FIG. 4.
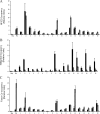
Quantitative ChIP analyses of regions of NF-E2 occupancy in the erythrocyte membrane protein genes. Data are presented as enrichment (_n_-fold) relative to total input. A region from HS2 of the β-globin LCR was included as a positive control (Pos), and a region from the cerebellum-specific GABRA6 gene was included as a negative control (Neg). (A) Validation of regions of NF-E2 occupancy in the 15 erythrocyte membrane protein genes. ChIP analyses of the 18 regions of NF-E2 occupancy in K562 and primary erythroid cell chromatin predicted by the Tamalpais peak calling algorithm were performed using antibodies against NF-E2. Black bars represent NF-E2-precipitated K562 cell chromatin. Gray bars represent NF-E2-precipitated primary erythroid cell chromatin. White bars represent IgG-precipitated K562 chromatin. (B) H3Me3K4 occupancy in regions of NF-E2 binding in K562 and HeLa chromatin. ChIP analyses of H3Me3K4 occupancy in regions of NF-E2 binding in K562 and HeLa chromatin were performed using an antibody against H3Me3K4. Black bars represent H3Me3K4-immunoprecipitated K562 chromatin. Gray bars represent H3Me3K4-immunoprecipitated HeLa chromatin. White bars represent IgG-precipitated K562 chromatin. (C) Cofactor binding in regions of NF-E2 occupancy. ChIP analyses of the 19 regions of NF-E2 occupancy in K562 cell chromatin were performed using antibodies against SCL and MTA-2. SCL and MTA-2 binding were present in all regions of NF-E2 occupancy. Black bars represent MTA-2-precipitated K562 chromatin. Gray bars represent SCL-precipitated K562 chromatin. White bars represent IgG-precipitated K562 chromatin.
FIG. 5.
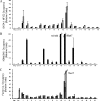
Quantitative ChIP analyses of regions of GATA-1 NF-E2 cooccupancy. Data are presented as enrichment (_n_-fold) relative to total input. (A) Validation of regions of GATA-1 and NF-E2 cooccupancy. ChIP analyses of the 18 regions of GATA-1 and NF-E2 cooccupancy in K562 and primary erythroid cell chromatin predicted by the Tamalpais peak calling algorithm were performed using antibodies against GATA-1 and NF-E2. Black bars represent GATA1-precipitated chromatin. Gray bars represent NF-E2-precipitated chromatin. White bars represent IgG-precipitated chromatin. A region from HS2 of the β-globin LCR was included as a positive control (Pos), and a region from the cerebellum-specific GABRA6 gene was included as a negative control (Neg). (B) H3Me3K4 occupancy in regions of GATA-1 NF-E2 cooccupancy in K562 chromatin. ChIP analyses of H3Me3K4 occupancy in regions of GATA-1 binding in K562 chromatin were performed using an antibody against H3Me3K4. Black bars represent H3Me3K4-immunoprecipitated K562 chromatin. White bars represent IgG-precipitated K562 chromatin. (C) Factor cooccupancy at sites of GATA-1-NF-E2 binding. ChIP analyses of the 18 regions of GATA-1 occupancy in K562 cell chromatin were performed using antibodies against FOG-1, SCL, and MTA-2. FOG-1, SCL, and MTA-2 binding are present in all regions of GATA-1 occupancy. Black bars represent FOG1-precipitated K562 cell chromatin. Gray bars represent MTA-2-precipitated K562 chromatin. Dark gray bars represent SCL-precipitated K562 chromatin. White bars represent IgG-precipitated K562 chromatin.
Similar articles
- Identification of biologically relevant enhancers in human erythroid cells.
Su MY, Steiner LA, Bogardus H, Mishra T, Schulz VP, Hardison RC, Gallagher PG. Su MY, et al. J Biol Chem. 2013 Mar 22;288(12):8433-8444. doi: 10.1074/jbc.M112.413260. Epub 2013 Jan 22. J Biol Chem. 2013. PMID: 23341446 Free PMC article. - Forced FOG1 expression in erythroleukemia cells: Induction of erythroid genes and repression of myelo-lymphoid transcription factor PU.1.
Fujiwara T, Sasaki K, Saito K, Hatta S, Ichikawa S, Kobayashi M, Okitsu Y, Fukuhara N, Onishi Y, Harigae H. Fujiwara T, et al. Biochem Biophys Res Commun. 2017 Apr 1;485(2):380-387. doi: 10.1016/j.bbrc.2017.02.068. Epub 2017 Feb 16. Biochem Biophys Res Commun. 2017. PMID: 28216155 - Functional interaction of CP2 with GATA-1 in the regulation of erythroid promoters.
Bosè F, Fugazza C, Casalgrandi M, Capelli A, Cunningham JM, Zhao Q, Jane SM, Ottolenghi S, Ronchi A. Bosè F, et al. Mol Cell Biol. 2006 May;26(10):3942-54. doi: 10.1128/MCB.26.10.3942-3954.2006. Mol Cell Biol. 2006. PMID: 16648487 Free PMC article. - Ldb1 complexes: the new master regulators of erythroid gene transcription.
Love PE, Warzecha C, Li L. Love PE, et al. Trends Genet. 2014 Jan;30(1):1-9. doi: 10.1016/j.tig.2013.10.001. Epub 2013 Nov 27. Trends Genet. 2014. PMID: 24290192 Free PMC article. Review. - Erythroid regulatory elements.
Raich N, Romeo PH. Raich N, et al. Stem Cells. 1993 Mar;11(2):95-104. doi: 10.1002/stem.5530110204. Stem Cells. 1993. PMID: 8096156 Review.
Cited by
- Erythropoiesis: insights from a genomic perspective.
Cha HJ. Cha HJ. Exp Mol Med. 2024 Oct;56(10):2099-2104. doi: 10.1038/s12276-024-01311-1. Epub 2024 Oct 1. Exp Mol Med. 2024. PMID: 39349824 Review. - Association of metallothionein 2A rs10636 with low mean corpuscular volume (MCV), low mean corpuscular haemoglobin (MCH) in healthy Taiwanese.
Chen RF, Chen PM, Pan CS, Huang CC, Chiang EI. Chen RF, et al. Sci Rep. 2023 Jan 23;13(1):1292. doi: 10.1038/s41598-022-27304-6. Sci Rep. 2023. PMID: 36690679 Free PMC article. - A Unique Epigenomic Landscape Defines Human Erythropoiesis.
Schulz VP, Yan H, Lezon-Geyda K, An X, Hale J, Hillyer CD, Mohandas N, Gallagher PG. Schulz VP, et al. Cell Rep. 2019 Sep 10;28(11):2996-3009.e7. doi: 10.1016/j.celrep.2019.08.020. Cell Rep. 2019. PMID: 31509757 Free PMC article. - Erythropoietin Signaling Regulates Key Epigenetic and Transcription Networks in Fetal Neural Progenitor Cells.
Sollinger C, Lillis J, Malik J, Getman M, Proschel C, Steiner L. Sollinger C, et al. Sci Rep. 2017 Oct 30;7(1):14381. doi: 10.1038/s41598-017-14366-0. Sci Rep. 2017. PMID: 29084993 Free PMC article. - GATA1 Activity Governed by Configurations of _cis_-Acting Elements.
Hasegawa A, Shimizu R. Hasegawa A, et al. Front Oncol. 2017 Jan 9;6:269. doi: 10.3389/fonc.2016.00269. eCollection 2016. Front Oncol. 2017. PMID: 28119852 Free PMC article. Review.
References
- Andrews, N. C., H. Erdjument-Bromage, M. B. Davidson, P. Tempst, and S. H. Orkin. 1993. Erythroid transcription factor NF-E2 is a haematopoietic-specific basic-leucine zipper protein. Nature 362:722-728. - PubMed
Publication types
MeSH terms
Substances
Grants and funding
- P30DK072442/DK/NIDDK NIH HHS/United States
- R01 HL065448/HL/NHLBI NIH HHS/United States
- P30 DK072442/DK/NIDDK NIH HHS/United States
- DK62039/DK/NIDDK NIH HHS/United States
- HL65448/HL/NHLBI NIH HHS/United States
- R01 DK062039/DK/NIDDK NIH HHS/United States
- K12 HD000850/HD/NICHD NIH HHS/United States
- K12HD000850/HD/NICHD NIH HHS/United States
LinkOut - more resources
Full Text Sources
Research Materials
Miscellaneous


