Regulatory mechanisms for adipose tissue M1 and M2 macrophages in diet-induced obese mice - PubMed (original) (raw)
. 2009 Nov;58(11):2574-82.
doi: 10.2337/db08-1475. Epub 2009 Aug 18.
Isao Usui, Agussalim Bukhari, Masashi Ikutani, Takeshi Oya, Yukiko Kanatani, Koichi Tsuneyama, Yoshinori Nagai, Kiyoshi Takatsu, Masaharu Urakaze, Masashi Kobayashi, Kazuyuki Tobe
Affiliations
- PMID: 19690061
- PMCID: PMC2768159
- DOI: 10.2337/db08-1475
Regulatory mechanisms for adipose tissue M1 and M2 macrophages in diet-induced obese mice
Shiho Fujisaka et al. Diabetes. 2009 Nov.
Abstract
Objective: To characterize the phenotypic changes of adipose tissue macrophages (ATMs) under different conditions of insulin sensitivity.
Research design and methods: The number and the expressions of marker genes for M1 and M2 macrophages from mouse epididymal fat tissue were analyzed using flow cytometry after the mice had been subjected to a high-fat diet (HFD) and pioglitazone treatment.
Results: Most of the CD11c-positive M1 macrophages and the CD206-positive M2 macrophages in the epididymal fat tissue were clearly separated using flow cytometry. The M1 and M2 macrophages exhibited completely different gene expression patterns. Not only the numbers of M1 ATMs and the expression of M1 marker genes, such as tumor necrosis factor-alpha and monocyte chemoattractant protein-1, but also the M1-to-M2 ratio were increased by an HFD and decreased by subsequent pioglitazone treatment, suggesting the correlation with whole-body insulin sensitivity. We also found that the increased number of M2 ATMs after an HFD was associated with the upregulated expression of interleukin (IL)-10, an anti-inflammatory Th2 cytokine, in the adipocyte fraction as well as in adipose tissue. The systemic overexpression of IL-10 by an adenovirus vector increased the expression of M2 markers in adipose tissue.
Conclusions: M1 and M2 ATMs constitute different subsets of macrophages. Insulin resistance is associated with both the number of M1 macrophages and the M1-to-M2 ratio. The increased expression of IL-10 after an HFD might be involved in the increased recruitment of M2 macrophages.
Figures
FIG. 1.
Effect of HFD and pioglitazone on gene expressions of epididymal fat tissue. Total RNA was isolated from the whole epididymal fat tissue, and real-time RT-PCR for the indicated genes was conducted as described in the
research design and methods
section. Data were normalized according to 18S mRNA level and presented as a value relative to that for normal diet–fed mice. The results are shown as means ± SE for five to eight animals per group. * P < 0.05; ** P < 0.01.
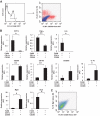
FIG. 2.
Gene profiles of macrophages positive or negative for CD11c and CD206 in epididymal fat tissue. Cells in the SVF of epididymal fat tissue from mice fed a HFD for 12 weeks were analyzed using flow cytometry. F4/80-positive cells were further analyzed with anti-CD11c and anti-CD206 antibodies. A: Representative flow cytometry results. Blue dots show isotype control. Total RNA was isolated from F4/80-positive/CD11c-positive/CD206-negative cells or F4/80-positive/CD11c-negative/CD206-positive cells. B: Real-time RT-PCR for the indicated genes was conducted as described in the
research design and methods
section. Data were normalized according to the 18S mRNA level. The results are shown as the means ± SE for four to seven animals per group. * P < 0.05; ** P < 0.01. The correlation between CD206 expression and **Mgl**I expression was examined. C: Representative results.
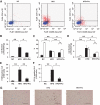
FIG. 3.
Effect of HFD and pioglitazone treatment on the number of M1/M2 macrophages in epididymal fat tissue. Cells in the SVF of epididymal fat tissue were analyzed using flow cytometry as described in Fig. 2. A: Representative results of flow cytometry are shown. B: The cell numbers in the F4/80-positive fraction. C and D: F4/80-positive/CD11c-positive/CD206-negative fraction (■) or F4/80-positive/CD11c-negative/CD206-positive fraction (□) were counted as described in the
research design and methods
section. C: The cell numbers in the CD11c-positive/CD206-negative and CD11c-negative/CD206-positive fractions are shown according to the percentage of each fraction per total F4/80-positive cells. D: The cell number in each fraction from 1 g of epididymal fat tissue. Epididymal fat tissues were stained with anti-F4/80 (E) or anti-CD11c antibody (F and G). E and F: The number of CLSs was counted as described in the
research design and methods
section. The results are shown as the means ± SE for five to eight animals per group. * P < 0.05; ** P < 0.01. G: Representative images with anti-CD11c antibody. Bar = 200 μm.
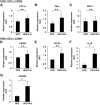
FIG. 4.
Effect of pioglitazone on gene expressions in CD11c-positive and -negative fractions. Macrophages in the F4/80-positive/CD11c-positive/CD206-negative fraction or the F4/80-positive/CD11c-negative/CD206-positive fraction of epididymal fat tissue were sorted using flow cytometry as described in Fig. 2. Total RNA was isolated, and real-time RT-PCR for the indicated genes was conducted as described in the
research design and methods
section. Data were normalized according to the 18S mRNA level. The results are shown as the means ± SE for six animals per group. * P < 0.05.
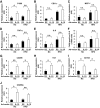
FIG. 5.
Effect of HFD and pioglitazone on gene expressions of adipocyte fraction in epididymal fat tissue. Total RNA from the adipocyte fraction was isolated, and real-time RT-PCR for the indicated genes was conducted as described in the
research design and methods
section. Data were normalized according to the 18S mRNA level. The results are shown as the means ± SE for six animals per group. * P < 0.05.
FIG. 6.
Effect of IL-10 overexpression on macrophage genes in epididymal fat tissue. Mice were fed with a normal chow (NC) or a HFD and were subsequently injected with either Ad-hIL-10 (IL-10) or a control vector (R2), then killed 4 days after injection. Purification of the mRNA and real-time RT-PCR for the indicated genes were performed as described in the
research design and methods
section. F: Epididymal fat tissues were stained with anti-F4/80 antibody. Then the number of CLSs was counted, as described in the
research design and methods
section. Results are shown as the mean ± SE of at least four mice per group. * P < 0.05; ** P < 0.01.
Similar articles
- Obesity induces a phenotypic switch in adipose tissue macrophage polarization.
Lumeng CN, Bodzin JL, Saltiel AR. Lumeng CN, et al. J Clin Invest. 2007 Jan;117(1):175-84. doi: 10.1172/JCI29881. J Clin Invest. 2007. PMID: 17200717 Free PMC article. - Dynamic, M2-like remodeling phenotypes of CD11c+ adipose tissue macrophages during high-fat diet--induced obesity in mice.
Shaul ME, Bennett G, Strissel KJ, Greenberg AS, Obin MS. Shaul ME, et al. Diabetes. 2010 May;59(5):1171-81. doi: 10.2337/db09-1402. Epub 2010 Feb 25. Diabetes. 2010. PMID: 20185806 Free PMC article. - The role of adipose tissue M1/M2 macrophages in type 2 diabetes mellitus.
Fujisaka S. Fujisaka S. Diabetol Int. 2020 Dec 15;12(1):74-79. doi: 10.1007/s13340-020-00482-2. eCollection 2021 Jan. Diabetol Int. 2020. PMID: 33479582 Free PMC article. Review. - Adipocyte-Macrophage Cross-Talk in Obesity.
Engin AB. Engin AB. Adv Exp Med Biol. 2017;960:327-343. doi: 10.1007/978-3-319-48382-5_14. Adv Exp Med Biol. 2017. PMID: 28585206 Review.
Cited by
- Ingesting Yogurt Containing Lactobacillus plantarum OLL2712 Reduces Abdominal Fat Accumulation and Chronic Inflammation in Overweight Adults in a Randomized Placebo-Controlled Trial.
Toshimitsu T, Gotou A, Sashihara T, Furuichi K, Hachimura S, Shioya N, Suzuki S, Asami Y. Toshimitsu T, et al. Curr Dev Nutr. 2021 Feb 3;5(2):nzab006. doi: 10.1093/cdn/nzab006. eCollection 2021 Feb. Curr Dev Nutr. 2021. PMID: 33718754 Free PMC article. - The Regulatory Function of Eosinophils.
Wen T, Rothenberg ME. Wen T, et al. Microbiol Spectr. 2016 Oct;4(5):10.1128/microbiolspec.MCHD-0020-2015. doi: 10.1128/microbiolspec.MCHD-0020-2015. Microbiol Spectr. 2016. PMID: 27780017 Free PMC article. Review. - Adipose tissue hypoxia induces inflammatory M1 polarity of macrophages in an HIF-1α-dependent and HIF-1α-independent manner in obese mice.
Fujisaka S, Usui I, Ikutani M, Aminuddin A, Takikawa A, Tsuneyama K, Mahmood A, Goda N, Nagai Y, Takatsu K, Tobe K. Fujisaka S, et al. Diabetologia. 2013 Jun;56(6):1403-12. doi: 10.1007/s00125-013-2885-1. Epub 2013 Mar 15. Diabetologia. 2013. PMID: 23494472 - Hypoxia as a Double-Edged Sword to Combat Obesity and Comorbidities.
Wang R, Sun Q, Wu X, Zhang Y, Xing X, Lin K, Feng Y, Wang M, Wang Y, Wang R. Wang R, et al. Cells. 2022 Nov 23;11(23):3735. doi: 10.3390/cells11233735. Cells. 2022. PMID: 36496995 Free PMC article. Review. - Alterations of lung microbial communities in obese allergic asthma and metabolic potential.
Lee J, Lee SH, Gu GJ, Choi JH, Jeong KT, Lee JK, Kim SH. Lee J, et al. PLoS One. 2021 Oct 28;16(10):e0256848. doi: 10.1371/journal.pone.0256848. eCollection 2021. PLoS One. 2021. PMID: 34710121 Free PMC article.
References
- Arkan MC, Hevener AL, Greten FR, et al. : IKK-beta links inflammation to obesity-induced insulin resistance. Nat Med 2005;11:191–198 - PubMed
- Hotamisligil GS: Inflammation and metabolic disorders. Nature 2006;444:860–867 - PubMed
Publication types
MeSH terms
Substances
LinkOut - more resources
Full Text Sources
Medical
Research Materials


