Natriuretic peptides/cGMP/cGMP-dependent protein kinase cascades promote muscle mitochondrial biogenesis and prevent obesity - PubMed (original) (raw)
. 2009 Dec;58(12):2880-92.
doi: 10.2337/db09-0393. Epub 2009 Aug 18.
Affiliations
- PMID: 19690065
- PMCID: PMC2780866
- DOI: 10.2337/db09-0393
Natriuretic peptides/cGMP/cGMP-dependent protein kinase cascades promote muscle mitochondrial biogenesis and prevent obesity
Kazutoshi Miyashita et al. Diabetes. 2009 Dec.
Abstract
Objective: Natriuretic peptides (NPs) have been characterized as vascular hormones that regulate vascular tone via guanylyl cyclase (GC), cyclic GMP (cGMP), and cGMP-dependent protein kinase (cGK). Recent clinical studies have shown that plasma NP levels were lower in subjects with the metabolic syndrome. The present study was conducted to elucidate the roles for NP/cGK cascades in energy metabolism.
Research design and methods: We used three types of genetically engineered mice: brain NP (BNP) transgenic (BNP-Tg), cGK-Tg, and guanylyl cyclase-A (GCA) heterozygous knockout (GCA(+/-)) mice and analyzed the metabolic consequences of chronic activation of NP/cGK cascades in vivo. We also examined the effect of NPs in cultured myocytes.
Results: BNP-Tg mice fed on high-fat diet were protected against diet-induced obesity and insulin resistance, and cGK-Tg mice had reduced body weight even on standard diet; surprisingly, giant mitochondria were densely packed in the skeletal muscle. Both mice showed an increase in muscle mitochondrial content and fat oxidation through upregulation of peroxisome proliferator-activated receptor (PPAR)-gamma coactivator (PGC)-1alpha and PPARdelta. The functional NP receptors, GCA and guanylyl cyclase-B, were downregulated by feeding a high-fat diet, while GCA(+/-) mice showed increases in body weight and glucose intolerance when fed a high-fat diet. NPs directly increased the expression of PGC-1alpha and PPARdelta and mitochondrial content in cultured myocytes.
Conclusions: The findings together suggest that NP/cGK cascades can promote muscle mitochondrial biogenesis and fat oxidation, as to prevent obesity and glucose intolerance. The vascular hormone, NP, would contribute to coordinated regulation of oxygen supply and consumption.
Figures
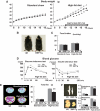
FIG. 1.
BNP-Tg mice are protected against diet-induced obesity and insulin resistance. Wild-type and BNP-Tg mice were given high-fat (60 kcal% fat) diet from the age of 10 weeks. A: Body weight of the BNP-Tg mice on standard diet (left panel) and a high-fat diet (right panel) (n = 18 per group on standard diet and n = 10 on high-fat diet). ▩, wild type; ■, BNT-Tg. B: Macroscopic appearance of a wild-type (Wt) and a BNP-Tg mouse fed on high-fat diet at 18 weeks of age. C: Food intake on standard diet and high-fat diet (n = 6). D: Blood glucose levels determined with the glucose and insulin tolerance tests (n = 8). ▩, wild type; ■, BNT-Tg. E: CT images obtained at kidney level of a wild-type (Wt) and a BNP-Tg mouse on standard diet (upper panel) and high-fat diet (lower panel). Subcutaneous fat (yellow), abdominal fat (red), and muscular region (blue) were distinguished. Total fat weight was estimated from the images (n = 6). F: Macroscopic appearances and weights of epididymal fat (upper panel) and mesenteric fat (lower panel). G: Microscopic analysis with hematoxylin and eosin staining of epididymal fat in high-fat–fed mice (left panels). Scale bar, 100 μm. Adipocyte size of epididymal fat in high-fat–fed mice was estimated from the histological analysis (right panel) (n = 8). H: Serum leptin and adiponectin levels (n = 8). I: Macroscopic appearance of the liver of the mice fed on high-fat diet (upper panel). Microscopic images of the liver stained with Oil red O (lower panel). Scale bar, 100 μm. J and K: Triglyceride concentrations in the liver (J) and the quadriceps (K) (n = 12). *P < 0.05; **P < 0.01 vs. wild-type (Wt) mice on the same feeding condition. (A high-quality color digital representation of this figure is available in the online issue.)
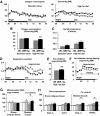
FIG. 2.
High-fat–fed BNP-Tg mice exhibit higher oxygen consumption and fat oxidation in association with increased mitochondrial content in the skeletal muscle. Mice were subjected to respiratory gas analysis after fed on high-fat diet. Total DNA and RNA were extracted from the brown adipose tissue and the quadriceps, and quantitative PCR analysis was performed. A: Oxygen consumption on standard diet (left panel) and high-fat diet (right panel) (n = 6). ▩, wild type; ■, BNP-Tg. B: Mean oxygen consumption for 24 h on standard diet or high-fat diet (n = 6). C: Rectal temperature on standard diet or high-fat diet (n = 6). D: Respiratory quotient of high-fat–fed mice (n = 6). ▩, wild type; ■, BNP-Tg. E: Mean fat oxidation estimated from the respiratory gas analysis for 24 h of high-fat–fed mice. F: Fat oxidation before and during fasting starting from midnight. ▩, wild type; ■, BNP-Tg. G: Mitochondrial DNA copy number estimated from quantification of mitochondrial and nuclear genome (n = 8). H: Expressions of genes encoding PGC-1α and UCP1 in the brown adipose tissue and those for PGC-1α and PPARδ in the skeletal muscle (n = 8). Standard diet: □, wild type; ▨, BNP-Tg. High-fat diet: ▩, wild type; ■, BNP-Tg. The values were standardized to those for the control (wild-type [Wt] mice fed on standard diet) in either group. *P < 0.05; **P < 0.01 vs. wild type on the same feeding condition.
FIG. 3.
The expressions of NP receptors are regulated by feeding condition, while GCA knockdown mice are susceptible to diet-induced obesity and glucose intolerance. Total RNA was extracted from the quadriceps of wild-type mice, and quantitative PCR analysis for the expressions of NP receptors was performed. Wild-type and GCA heterozygous knockout mice (GCA+/−) were given a high-fat (45 kcal% fat) diet from the age of 8 weeks. A: Expressions of GCA, GCB, and C-receptor in the skeletal muscle, brown adipose tissue, and white adipose tissue of wild-type mice for indicated feeding condition (n = 8). The values represent the expression levels of each gene compared with that of β-actin determined by quantitative PCR analysis. Statistical analysis was performed to evaluate the effects of fasting and high-fat diet. *P < 0.05; **P < 0.01 vs. ad libitum eating on the same diet. #P < 0.05; ##P < 0.01 vs. standard diet on the same eating condition (ad libitum or fasting). Further analysis to clarify whether there were interactions between the effect of fasting and that of high-fat diet was performed as shown in supplemental Table S2. ▩, skeletal muscle; ■, brown adipose tissue; □, white adipose tissue. B: Body weight of wild-type (Wt) and GCA+/− mice fed on standard diet (dotted lines) or high-fat diet (solid lines) after 8 weeks of age (n = 8). C: Food intake on high-fat diet (n = 6). D: Blood glucose levels determined with the glucose tolerance test (n = 8). ▩, wild type; ■, GCA+/−. E: Total fat weight estimated from the CT images (n = 6). *P < 0.05; **P < 0.01 vs. wild type on the same feeding condition. GCA+/−, GCA heterozygous knockout mice.
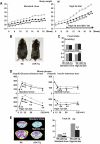
FIG. 4.
cGK-Tg mice are lean and insulin sensitive even on standard diet. Wild-type and cGK-Tg mice were given a high-fat (60 kcal% fat) diet from the age of 10 weeks. A: Body weight of cGK-Tg mice on standard diet (left panel) and high-fat diet (right panel) (n = 8–10). ▩, wild type; ■, cGK-Tg. B: Macroscopic appearance of a wild-type (Wt) and a cGK-Tg mouse. C: Food intake on standard and high-fat diet (upper panel) (kcal/day, n = 6) and the body weight (BW)-adjusted value (lower panel) (kcal · day−1 · g body wt−1). D: Blood glucose levels determined with the glucose and insulin tolerance tests for each genotype on standard diet and high-fat diet (n = 8). ▩, wild type; ■, cGK-Tg. E: CT images obtained at kidney level of a wild-type (Wt) and a cGK-Tg mouse on standard diet (upper panel) and high-fat diet (lower panel). Subcutaneous fat (yellow), abdominal fat (red), and muscular region (blue) were distinguished. Total fat weight was estimated from the images (n = 6). F: Microscopic analysis using hematoxylin and eosin staining of epididymal fats in high-fat–fed mice. Scale bar, 100 μm. G: Distribution of adipocyte diameter determined with Coulter counter (n = 8). ▩, wild type; ■, cGK-Tg. H: Macroscopic appearance of the liver in high-fat–fed mice (upper panel). Microscopic images with Oil red O staining of the liver (lower panel). Scale bar, 100 μm. I and J: Triglyceride concentration in the liver (I) and the quadriceps (J) (n = 12). *P < 0.05; **P < 0.01 vs. wild type on the same feeding condition. (A high-quality color digital representation of this figure is available in the online issue.)
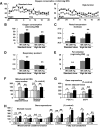
FIG. 5.
cGK-Tg mice exhibit giant mitochondria in the skeletal muscle, associated with higher oxygen consumption and fat oxidation. Mice were subjected to respiratory gas analysis after fed on high-fat diet. Total DNA and RNA were extracted from the brown adipose tissue and the quadriceps, and quantitative PCR analysis was performed. A: Oxygen consumption on standard diet (n = 6). ▩, wild type; ■, cGK-Tg. B: Mean oxygen consumption for 24 h on standard or high-fat diet. C: Rectal temperature on standard or high-fat diet (n = 12). D: Mean respiratory quotient for 24 h on standard or high-fat diet (n = 6). E: Mean fat oxidation estimated from the respiratory gas analysis for 24 h on standard or high-fat diet (n = 6). F: Mitochondrial DNA copy number estimated from quantification of mitochondrial and nuclear genome (n = 8). G: Expressions of genes encoding PGC-1α and UCP1 in the brown adipose tissue. The values were standardized to those for the control (wild-type [Wt] mice fed on standard diet) in either group (n = 12). H: Expressions of the genes involved in mitochondrial regulation or fatty acid catabolism in the skeletal muscle (n = 12). Standard diet: □, wild type (control); ▨, cGK-Tg. High-fat diet: ▩, wild type; ■, cGK-Tg. I: Electron microscopic analysis of muscle mitochondria of high-fat–fed cGK-Tg mice. *P < 0.05; **P < 0.01 vs. wild-type mice on the same feeding condition.
FIG. 6.
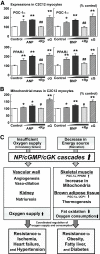
NPs directly increase the expression of PGC-1α and PPARδ and mitochondrial content in cultured myocytes. C2C12 myocytes were stimulated with the indicated agents for 8 (A) or 48 (B) hours (ANP 10−11∼−9 mol/l or BNP 10−11∼−9 mol/l, with or without the cGMP antagonist, Rp-8-br-cGMP [Rp] 10−4 mol/l). Stimulation of cGK by 8-Br-cGMP (cG) 10−4 mol/l was also challenged (n = 12). A: Gene expressions of PGC-1α and PPARδ in C2C12 cells when treated with ANPs or BNPs. B: Mitochondrial mass in C2C12 cells quantified by use of MitoTracker Green, a fluorescent probe for mitochondria. *P < 0.05; **P < 0.01 vs. control; #P < 0.05; ##P < 0.01 vs. the NP (10−9 mol/l)-treated group. Rp, Rp-8-br-cGMP (cGMP antagonist), cG, 8-Br-cGMP (membrane-permeable cGMP analog). C: Schematic representation of the suggested roles for NP/cGK cascades. Previous studies have shown the significant roles for NP/cGK cascades in the cardiovascular system that lead to resistance to ischemia, heart failure, and hypertension. In the present study, NP/cGK cascades are suggested to promote muscle mitochondrial biogenesis and fat oxidation, as to prevent obesity, fatty liver, and glucose intolerance.
Comment in
- Natriuretic peptides: new players in energy homeostasis.
Moro C, Smith SR. Moro C, et al. Diabetes. 2009 Dec;58(12):2726-8. doi: 10.2337/db09-1335. Diabetes. 2009. PMID: 19940236 Free PMC article. No abstract available.
Similar articles
- β Cell-specific deletion of guanylyl cyclase A, the receptor for atrial natriuretic peptide, accelerates obesity-induced glucose intolerance in mice.
Tauscher S, Nakagawa H, Völker K, Werner F, Krebes L, Potapenko T, Doose S, Birkenfeld AL, Baba HA, Kuhn M. Tauscher S, et al. Cardiovasc Diabetol. 2018 Jul 17;17(1):103. doi: 10.1186/s12933-018-0747-3. Cardiovasc Diabetol. 2018. PMID: 30016962 Free PMC article. - Natriuretic peptides enhance the oxidative capacity of human skeletal muscle.
Engeli S, Birkenfeld AL, Badin PM, Bourlier V, Louche K, Viguerie N, Thalamas C, Montastier E, Larrouy D, Harant I, de Glisezinski I, Lieske S, Reinke J, Beckmann B, Langin D, Jordan J, Moro C. Engeli S, et al. J Clin Invest. 2012 Dec;122(12):4675-9. doi: 10.1172/JCI64526. Epub 2012 Nov 1. J Clin Invest. 2012. PMID: 23114600 Free PMC article. - Sarcolipin Is a Key Determinant of the Basal Metabolic Rate, and Its Overexpression Enhances Energy Expenditure and Resistance against Diet-induced Obesity.
Maurya SK, Bal NC, Sopariwala DH, Pant M, Rowland LA, Shaikh SA, Periasamy M. Maurya SK, et al. J Biol Chem. 2015 Apr 24;290(17):10840-9. doi: 10.1074/jbc.M115.636878. Epub 2015 Feb 24. J Biol Chem. 2015. PMID: 25713078 Free PMC article. - Electrophysiological effects of natriuretic peptides in the heart are mediated by multiple receptor subtypes.
Moghtadaei M, Polina I, Rose RA. Moghtadaei M, et al. Prog Biophys Mol Biol. 2016 Jan;120(1-3):37-49. doi: 10.1016/j.pbiomolbio.2015.12.001. Epub 2015 Dec 15. Prog Biophys Mol Biol. 2016. PMID: 26701223 Review. - Central role of guanylyl cyclase in natriuretic peptide signaling in hypertension and metabolic syndrome.
Martel G, Hamet P, Tremblay J. Martel G, et al. Mol Cell Biochem. 2010 Jan;334(1-2):53-65. doi: 10.1007/s11010-009-0326-8. Epub 2009 Nov 25. Mol Cell Biochem. 2010. PMID: 19937369 Review.
Cited by
- Downregulation in GATA4 and Downstream Structural and Contractile Genes in the db/db Mouse Heart.
Broderick TL, Jankowski M, Wang D, Danalache BA, Parrott CR, Gutkowska J. Broderick TL, et al. ISRN Endocrinol. 2012;2012:736860. doi: 10.5402/2012/736860. Epub 2012 Mar 13. ISRN Endocrinol. 2012. PMID: 22474596 Free PMC article. - The atrial natriuretic peptide genetic variant rs5068 is associated with a favorable cardiometabolic phenotype in a Mediterranean population.
Cannone V, Cefalu' AB, Noto D, Scott CG, Bailey KR, Cavera G, Pagano M, Sapienza M, Averna MR, Burnett JC Jr. Cannone V, et al. Diabetes Care. 2013 Sep;36(9):2850-6. doi: 10.2337/dc12-2337. Epub 2013 May 1. Diabetes Care. 2013. PMID: 23637347 Free PMC article. - Molecular and genetic aspects of guanylyl cyclase natriuretic peptide receptor-A in regulation of blood pressure and renal function.
Pandey KN. Pandey KN. Physiol Genomics. 2018 Nov 1;50(11):913-928. doi: 10.1152/physiolgenomics.00083.2018. Epub 2018 Aug 31. Physiol Genomics. 2018. PMID: 30169131 Free PMC article. Review. - Conflicting relationship between age-dependent disorders, valvular heart disease and coronary artery disease by covariance structure analysis: Possible contribution of natriuretic peptide.
Fukumoto R, Kawai M, Minai K, Ogawa K, Yoshida J, Inoue Y, Morimoto S, Tanaka T, Nagoshi T, Ogawa T, Yoshimura M. Fukumoto R, et al. PLoS One. 2017 Jul 20;12(7):e0181206. doi: 10.1371/journal.pone.0181206. eCollection 2017. PLoS One. 2017. PMID: 28727835 Free PMC article. - The thermogenic actions of natriuretic peptide in brown adipocytes: The direct measurement of the intracellular temperature using a fluorescent thermoprobe.
Kimura H, Nagoshi T, Yoshii A, Kashiwagi Y, Tanaka Y, Ito K, Yoshino T, Tanaka TD, Yoshimura M. Kimura H, et al. Sci Rep. 2017 Oct 11;7(1):12978. doi: 10.1038/s41598-017-13563-1. Sci Rep. 2017. PMID: 29021616 Free PMC article.
References
- Potter LR, Abbey-Hosch S, Dickey DM: Natriuretic peptides, their receptors, and cyclic guanosine monophosphate-dependent signaling functions. Endocr Rev 2006; 27: 47– 72 - PubMed
- Colucci WS, Elkayam U, Horton DP, Abraham WT, Bourge RC, Johnson AD, Wagoner LE, Givertz MM, Liang CS, Neibaur M, Haught WH, LeJemtel TH: Intravenous nesiritide, a natriuretic peptide, in the treatment of decompensated congestive heart failure. Nesiritide Study Group N Engl J Med 2000; 343: 246– 253 - PubMed
- Yamahara K, Itoh H, Chun TH, Ogawa Y, Yamashita J, Sawada N, Fukunaga Y, Sone M, Yurugi-Kobayashi T, Miyashita K, Tsujimoto H, Kook H, Feil R, Garbers DL, Hofmann F, Nakao K: Significance and therapeutic potential of the natriuretic peptides/cGMP/cGMP-dependent protein kinase pathway in vascular regeneration. Proc Natl Acad Sci USA 2003; 100: 3404– 3409 - PMC - PubMed
- Park K, Itoh H, Yamahara K, Sone M, Miyashita K, Oyamada N, Sawada N, Taura D, Inuzuka M, Sonoyama T, Tsujimoto H, Fukunaga Y, Tamura N, Nakao K: Therapeutic potential of atrial nariuretic peptide administration on peripheral arterial diseases. Endocrinology 2008; 149: 483– 491 - PubMed
- Yasoda A, Komatsu Y, Chusho H, Miyazawa T, Ozasa A, Miura M, Kurihara T, Rogi T, Tanaka S, Suda M, Tamura N, Ogawa Y, Nakao K: Overexpression of CNP in chondrocytes rescues achondroplasia through a MAPK-dependent pathway. Nat Med 2004; 10: 80– 86 - PubMed
Publication types
MeSH terms
Substances
LinkOut - more resources
Full Text Sources
Other Literature Sources
Medical
Molecular Biology Databases
Miscellaneous
