A comprehensive framework of E2-RING E3 interactions of the human ubiquitin-proteasome system - PubMed (original) (raw)
A comprehensive framework of E2-RING E3 interactions of the human ubiquitin-proteasome system
Sjoerd J L van Wijk et al. Mol Syst Biol. 2009.
Erratum in
- Mol Syst Biol. 2009;5:317
Abstract
Covalent attachment of ubiquitin to substrates is crucial to protein degradation, transcription regulation and cell signalling. Highly specific interactions between ubiquitin-conjugating enzymes (E2) and ubiquitin protein E3 ligases fulfil essential roles in this process. We performed a global yeast-two hybrid screen to study the specificity of interactions between catalytic domains of the 35 human E2s with 250 RING-type E3s. Our analysis showed over 300 high-quality interactions, uncovering a large fraction of new E2-E3 pairs. Both within the E2 and the E3 cohorts, several members were identified that are more versatile in their interaction behaviour than others. We also found that the physical interactions of our screen compare well with reported functional E2-E3 pairs in in vitro ubiquitination experiments. For validation we confirmed the interaction of several versatile E2s with E3s in in vitro protein interaction assays and we used mutagenesis to alter the E3 interactions of the E2 specific for K63 linkages, UBE2N(Ubc13), towards the K48-specific UBE2D2(UbcH5B). Our data provide a detailed, genome-wide overview of binary E2-E3 interactions of the human ubiquitination system.
Conflict of interest statement
The authors declare that they have no conflict of interest.
Figures
Figure 1
Outline array based, mating yeast two-hybrid matrix screen. (A) Organization of LexA–E2 fusions as three independent bacterial triplicate clones and an empty LexA vector. (B) LexA–E2 protein expression levels. Total protein lysates of yeast cells transformed with LexA–E2 fusions were resolved on SDS–PAGE, transferred to membranes and probed with either LexA antibody or yeast tubulin (TUB1). (C) Overview of experimental yeast two-hybrid screening procedure. EGY48α cells were transformed with 36 LexA–E2 fusions and EGY48a cells were transformed with 250 B42–RING-fusions. Screening for pair-wise E2–E3 interactions was carried out by standardized array-based mating between EGY48α and EGY48a cells on YPD for 24 h at 30°C, followed by diploid selection on SC HWU− for 48 h at 30°C. Interactions were visualized by transferring diploids on SC HWU− X-Gal (colorimetric selection) or on SC HWUL− (auxotrophic selection) under both B42-inducing (galactose as main carbon source) and repressive (glucose) conditions. Digital images of the interactions were taken at 3, 24-h interval time points. (D) Overview of standardized LexA–E2 array. Each spot represents EGY48α cells transformed with the indicated LexA–E2 fusion construct. Spots with a red square contained LexA–UBE2D2 and LexA–UBE2D2 K63E constructs and were mated throughout the entire procedure with EGY48a cells transformed with B42–CNOT4 N63 as positive and negative interaction controls, respectively. Spots with a green square were transformed with LexA–Caf40 and LexA–CNOT2-15 and served as auto-activating controls. Blue squared spots represent either EGY48a cells transformed with LexA-empty vector and an untransformed EGY48α strain, as mating/growing controls.
Figure 2
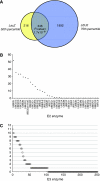
Topological characterization of the E2–E3 network. (A) Venn diagram showing the shared E2–E3 interactions in the 75th percentile selected LEU2-set and the 50th percentile selected LacZ-set and the overlap between them. (B) Distribution of the E3 connectivity for each individual E2. Depicted are the numbers of E3 interactions observed in the shared LacZ- and LEU2-set among all interactions of a single E2. (C) Distribution of the E2 connectivity for each individual E3, idem as panel B.
Figure 3
E2–E3 network. A network graph of binary E2–E3 domain interactions involving 124 E2 and E3 domains linked through 346 interactions. Nodes (domains) are shown as circles and interactions between them as black lines. E2 domains are shown as red circles and E3 domains as blue circles. The size of each node is linear related to the number of links of that node. Red square depicts E2 hub proteins, blue square hub E3s. Figure was generated using Cytoscape v.2.6.1.
Figure 4
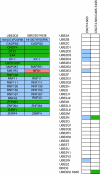
Mutant UbcH5B and mutant CNOT4–N63 interactions. (A) Overview of RING E3 interaction patterns between wild type and UBE2D2(UbcH5B) (K63E). E3s in purple interacted with both wild type and mutant UBE2D2(UbcH5B), in green only with wild-type UBE2D2(UbcH5B) and in pink only with the K63E mutant. (B) E2 interaction pattern of wild type and mutant CNOT-N63. White indicates no interaction, purple or green an interaction with CNOT4-N63 or CNOT4-N63 D49K/E49K, respectively.
Figure 5
Quality of the E2–E3 network. Physical E2–E3 interactions in relation to literature-curated, functional E2–E3 pairs. Hub node E3s were selected and interactions with E2s were scored when biochemically tested in in vitro ubiquitination assays as reported in literature.
Figure 6
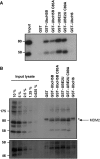
UBE2U physically interacts with MDM2. (A) HEK293T cells were transiently transfected with myc-tagged MDM2, lysed and incubated with GST–E2s immobilized on gluthathion-agarose beads. Bound material was resolved on 7.5% SDS–PAGE and proteins were visualized after immunoblotting with antibodies against myc. (B) Untransfected U2OS cells were lysed and combined with GST–E2s as in panel A. Immunoblotting was carried out using MDM2 antibodies (upper panel) and using p53 antibodies after reprobing (lower panel). Arrow indicates MDM2 signal, asterisk indicates background band.
Figure 7
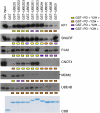
GST-pull-down analysis between (hub) E2 and E3 enzymes. To validate yeast two-hybrid interactions, GST-pull-down analysis was performed between ten E2 enzymes and six E3 ligases. Approximately 10 μg GST–E2 enzyme were immobilized on G/A-beads and incubated with crude lysates expressing 6xhis–RING constructs. Bound proteins were resolved on SDS–PAGE, immono blotted and proteins were visualized using anti-6xhis antibodies. GST–E2 levels were visualized using Coomassie brilliant blue staining. An asterisk indicates a specific signal.
Figure 8
Design of a UBE2N derivative with a new E3 interaction specificity. (A) Sequence alignment of UBE2D2(UbcH5B) and UBE2N(Ubc13). Secondary structure elements (indicated on top in purple and green for the UBE2D2-specific extension of helix 1) and regions involved in E3 RING interactions were derived from the E2 crystal structures (PDB codes 2ESK and 1JBB for UBE2D2 and UBE2N, respectively). Amino acids are coloured according to their physico-chemical properties. (B) E3 interaction patterns of UBE2D2, UBE2N and UBE2N mutants. The library of 251 yeast clones expressing B42–RING fusions were re-arrayed on three 96-well plates and mated with LexA–E2 expressing yeast clones. Diploids were selected and interactions were visualized as described in Figure 1. Pictures were taken after 72 h incubation at 30°C. Upper and lower three squares in the outer two columns of each plate represent plate controls. (C) Quantification of wild type and mutant E2–E3 interactions. Spot staining (LacZ) and spot sizes (LEU2) of each E2–E3 interaction were quantified and corrected for background signals. Individual E2–E3 interactions are depicted as bars; black bars indicate no interaction and coloured bars indicate E2–E3 interactions. (D) Venn diagram showing the overlap in E3 interactions between the different E2 enzymes. (E) Expression of wild type and mutant E2 enzymes. Total cell lysates of yeast cells expressing the indicated LexA–E2 fusions were separated on 12.5% SDS–PAGE and analysed by immunoblotting using antibodies against LexA or tubulin (TUB1) as loading control.
Similar articles
- Dynamic interactions of proteins in complex networks: identifying the complete set of interacting E2s for functional investigation of E3-dependent protein ubiquitination.
Christensen DE, Klevit RE. Christensen DE, et al. FEBS J. 2009 Oct;276(19):5381-9. doi: 10.1111/j.1742-4658.2009.07249.x. Epub 2009 Aug 27. FEBS J. 2009. PMID: 19712108 Free PMC article. Review. - Human proteome-scale structural modeling of E2-E3 interactions exploiting interface motifs.
Kar G, Keskin O, Nussinov R, Gursoy A. Kar G, et al. J Proteome Res. 2012 Feb 3;11(2):1196-207. doi: 10.1021/pr2009143. Epub 2012 Jan 10. J Proteome Res. 2012. PMID: 22149024 Free PMC article. - Mechanistic insight into the allosteric activation of a ubiquitin-conjugating enzyme by RING-type ubiquitin ligases.
Ozkan E, Yu H, Deisenhofer J. Ozkan E, et al. Proc Natl Acad Sci U S A. 2005 Dec 27;102(52):18890-5. doi: 10.1073/pnas.0509418102. Epub 2005 Dec 19. Proc Natl Acad Sci U S A. 2005. PMID: 16365295 Free PMC article. - Structural insights into the nanomolar affinity of RING E3 ligase ZNRF1 for Ube2N and its functional implications.
Behera AP, Naskar P, Agarwal S, Banka PA, Poddar A, Datta AB. Behera AP, et al. Biochem J. 2018 May 9;475(9):1569-1582. doi: 10.1042/BCJ20170909. Biochem J. 2018. PMID: 29626159 Free PMC article. - Structural basis of generic versus specific E2-RING E3 interactions in protein ubiquitination.
Gundogdu M, Walden H. Gundogdu M, et al. Protein Sci. 2019 Oct;28(10):1758-1770. doi: 10.1002/pro.3690. Epub 2019 Aug 23. Protein Sci. 2019. PMID: 31340062 Free PMC article. Review.
Cited by
- An evolutionarily conserved innate immunity protein interaction network.
De Arras L, Seng A, Lackford B, Keikhaee MR, Bowerman B, Freedman JH, Schwartz DA, Alper S. De Arras L, et al. J Biol Chem. 2013 Jan 18;288(3):1967-78. doi: 10.1074/jbc.M112.407205. Epub 2012 Dec 3. J Biol Chem. 2013. PMID: 23209288 Free PMC article. - An adaptive stress response that confers cellular resilience to decreased ubiquitination.
Hunt LC, Pagala V, Stephan A, Xie B, Kodali K, Kavdia K, Wang YD, Shirinifard A, Curley M, Graca FA, Fu Y, Poudel S, Li Y, Wang X, Tan H, Peng J, Demontis F. Hunt LC, et al. Nat Commun. 2023 Nov 14;14(1):7348. doi: 10.1038/s41467-023-43262-7. Nat Commun. 2023. PMID: 37963875 Free PMC article. - Structure of the human FANCL RING-Ube2T complex reveals determinants of cognate E3-E2 selection.
Hodson C, Purkiss A, Miles JA, Walden H. Hodson C, et al. Structure. 2014 Feb 4;22(2):337-44. doi: 10.1016/j.str.2013.12.004. Epub 2014 Jan 2. Structure. 2014. PMID: 24389026 Free PMC article. - EVI/WLS function is regulated by ubiquitylation and is linked to ER-associated degradation by ERLIN2.
Wolf LM, Lambert AM, Haenlin J, Boutros M. Wolf LM, et al. J Cell Sci. 2021 Aug 15;134(16):jcs257790. doi: 10.1242/jcs.257790. Epub 2021 Aug 18. J Cell Sci. 2021. PMID: 34406391 Free PMC article. - A putative SUMO interacting motif in the B30.2/SPRY domain of rhesus macaque TRIM5α important for NF-κB/AP-1 signaling and HIV-1 restriction.
Nepveu-Traversy MÉ, Demogines A, Fricke T, Plourde MB, Riopel K, Veillette M, Diaz-Griffero F, Sawyer SL, Berthoux L. Nepveu-Traversy MÉ, et al. Heliyon. 2016 Jan 21;2(1):e00056. doi: 10.1016/j.heliyon.2015.e00056. eCollection 2016 Jan. Heliyon. 2016. PMID: 27441239 Free PMC article.
References
- Anandasabapathy N, Ford GS, Bloom D, Holness C, Paragas V, Seroogy C, Skrenta H, Hollenhorst M, Fathman CG, Soares L (2003) GRAIL: an E3 ubiquitin ligase that inhibits cytokine gene transcription is expressed in anergic CD4+ T cells. Immunity 18: 535–547 - PubMed
- Ardley HC, Robinson PA (2005) E3 ubiquitin ligases. Essays Biochem 41: 15–30 - PubMed
- Berleth ES, Pickart CM (1996) Mechanism of ubiquitin conjugating enzyme E2-230K: catalysis involving a thiol relay? Biochemistry 35: 1664–1671 - PubMed
- Bernassola F, Karin M, Ciechanover A, Melino G (2008) The HECT family of E3 ubiquitin ligases: multiple players in cancer development. Cancer Cell 14: 10–21 - PubMed
Publication types
MeSH terms
Substances
LinkOut - more resources
Full Text Sources
Other Literature Sources
Molecular Biology Databases
Miscellaneous


