Metabolomics-driven quantitative analysis of ammonia assimilation in E. coli - PubMed (original) (raw)
Metabolomics-driven quantitative analysis of ammonia assimilation in E. coli
Jie Yuan et al. Mol Syst Biol. 2009.
Abstract
Despite extensive study of individual enzymes and their organization into pathways, the means by which enzyme networks control metabolite concentrations and fluxes in cells remains incompletely understood. Here, we examine the integrated regulation of central nitrogen metabolism in Escherichia coli through metabolomics and ordinary-differential-equation-based modeling. Metabolome changes triggered by modulating extracellular ammonium centered around two key intermediates in nitrogen assimilation, alpha-ketoglutarate and glutamine. Many other compounds retained concentration homeostasis, indicating isolation of concentration changes within a subset of the metabolome closely linked to the nutrient perturbation. In contrast to the view that saturated enzymes are insensitive to substrate concentration, competition for the active sites of saturated enzymes was found to be a key determinant of enzyme fluxes. Combined with covalent modification reactions controlling glutamine synthetase activity, such active-site competition was sufficient to explain and predict the complex dynamic response patterns of central nitrogen metabolites.
Conflict of interest statement
The authors declare that they have no conflict of interest.
Figures
Figure 1
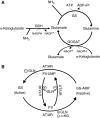
Ammonia assimilating pathways and regulation of glutamine synthetase in E. coli. (A) Ammonia can be assimilated through either glutamate dehydrogenase (GDH) or the glutamine synthetase/glutamate synthase cycle (GS/GOGAT). For each turn of the GS/GOGAT cycle, one molecule of ammonia is assimilated into glutamate. (B) GS catalytic activity is regulated by the bifunctional enzyme adenylyltransferase/adenylyl-removing enzyme (AT/AR), with adenylylation inactivating GS. The activity of AT/AR is regulated by the signaling protein PII, which is itself covalently modified by another bifunctional enzyme, uridylyltransferase/uridylyl-removing enzyme (UT/UR). Unmodified PII indicates nitrogen sufficiency and promotes GS adenylylation. Glutamine and α-ketoglutarate allosterically regulate AT/AR and UT/UR as shown.
Figure 2
Filter cultures grown with 2 mM ammonia become nitrogen-limited. (A) Growth of wild-type E. coli with 10 mM ammonium (gray triangles) or 2 mM ammonium (blue triangles) as the nitrogen source. The cells grown in 2 mM ammonium become nitrogen-limited, as indicated by reduced growth rate, after ∼3 h (OD∼0.4). Nitrogen upshift at this point (to 10 mM ammonium plates) partially restores growth rate (blue circles). Error bars show ±s.d. of _N_=3 independent experiments. Lines show fits to exponential growth functions. (B) The ammonia concentration at the surface of the plate becomes depleted coincident with slowing of cellular growth. This depletion is stronger in wild-type cells (black bars) than ΔGOGAT ones (white bars). Error bars show ±s.d. of _N_=3 independent experiments. (C) Western blots of GS (upper) and GDH (lower) in wild-type (WT), ΔGDH, and ΔGOGAT E. coli grown with either proline (pro*), 10 mM ammonia (10) or 2 mM ammonia (2) as the sole nitrogen source. Cells were grown in filter culture on plates to the point of nitrogen limitation (3 h) before sample collection. To obtain a rough estimate of fold over- or under-expression of enzymes in the ΔGOGAT strain, samples were diluted 1:2 or 1:4 in lysis buffer before electrophoresis, as indicated. (D) Competition of ΔlacZ (but otherwise wild type) E. coli with ΔGOGAT E. coli on plates with 2 or 10 mM ammonia as the sole nitrogen source. Error bars show ±s.d. of _N_=4 independent experiments.
Figure 3
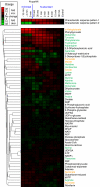
Metabolome dynamics during ammonia upshift. Columns represent different time points before and after shift from limiting ammonia to 10 mM ammonia. The upshift was applied at _t_=0 min as indicated by the arrow. Fold-change is relative to exponentially growing cells. The data represent the average of _N_=4 independent experiments. The two most characteristic metabolite response patterns, as identified by singular value decomposition (SVD), are shown above the metabolite heat map. Names of amino acids are in green and those of TCA cycle intermediates are in orange.
Figure 4
Measured and modeled dynamics of central nitrogen assimilation intermediates. Symbols represent experimental measurements (_N_=4 for independent experiments for wild type and _N_=2 for ΔGDH and ΔGOGAT). Error bars represent ±s.e., including propagation of error from prior absolute quantitation measurements (see Materials and methods). Lines represent the output of the dynamic model for GLN, GLU, and ASP. For α-ketoglutarate (which was an input to the model), the lines are a multistep linear fit to the data.
Figure 5
Elements of the nitrogen assimilation model. The ODE model describes the processes by which ammonia is taken up (N-assimilation) and nitrogen is distributed to biosynthetic pathways (N-utilization). The concentration of species within the dashed boxes (GLU, GLN, ASP, intracellular NH3, and unmodified GS and PII) are calculated as variables by the model, whereas those outside the boxes (α-KG, OA, and extracellular NH3) must be provided as inputs. N-assimilation consists of five metabolic and regulatory reactions: (1) glutamate dehydrogenase, GDH; (2) glutamine synthetase, GS; (3) glutamate synthase, GOGAT; (4) adenylyltransferase/adenylyl-removing enzyme, AT/AR; (5) uridylyltransferase/uridylyl-removing enzyme, UT/UR. Ammonia enters the cell by passive diffusion across the membrane. N-utilization consists of two different classes of reactions, which consume amino acids: those in which a nitrogen group is transferred to an acceptor molecule, recycling the carbon skeleton (N-donation) and those that consume the entire metabolite (protein and biosynthesis). In the model, the rate of GLN, GLU, and ASP consumption for biosynthesis and protein production was taken to be proportional to growth rate (for details, see Supplementary Table 5).
Figure 6
Fluxes and pool sizes under nitrogen limitation were generally robust to changes in model parameters. Simulations were performed in which a single model parameter was multiplied by a factor of (from left to right) 1/16, 1/8, 1/4, 1/2, 2, 4, 8, or 16, and the nitrogen-limited steady-state pool sizes of GLU and GLN, the fluxes in the GS/GOGAT cycle, and the growth rate were calculated. Values shown are ratios between the perturbed simulation and the original. Gray boxes indicate simulations, which did not reach steady state. GOGAT, glutamate synthase; GS, glutamine synthetase; GDH, glutamate dehydrogenase; AT, adenyltransferase; AR, adenyl-removing enzyme; UT, uridyltransferase; UR, uridyl-removing enzyme; AST, aspartate aminotransferase; _k_diff, the diffusion constant for ammonia across the cell membrane. When referring to a _K_m or _K_i value, the substrate is listed after _K_m/i, for example, the _K_m of GOGAT for glutamine is listed GOGAT _K_m Gln.
Figure 7
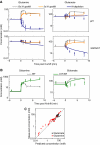
Comparison of model predictions and experimental observations for (A) additional ammonia perturbations and (B) N-upshift in the ΔAT/AR genetic background; (C) plots the overall extent of agreement. In panels A and B, symbols represent experimental measurements (_N_=4 for independent experiments for wild type and _N_=2 for mutants). Error bars represent ±s.e., including propagation of error from prior absolute quantitation measurements (see Materials and methods). Lines represent the model predictions generated independently from the experimental data. (A) The 13-fold ammonia upshift as per Figure 4 (gray), 3-fold upshift (orange), and N-depletion (dark blue) for the metabolite labeled on top and genetic background on the right. (B) The 13-fold ammonia upshift for wild type (gray) and ΔAT/AR (green), for the metabolite labeled on top. (C) Truth plot showing the correlation between predicted and measured concentrations. Data presented in panels A and B (omitting those in gray, which were used in model training) were pooled to assess the overall predictive power of the model. For each data point, the x axis reflects the model prediction and the y axis the measured concentration. The line is a fit to equation _Y_=X, with _R_=0.85.
Similar articles
- Flux balance analysis of ammonia assimilation network in E. coli predicts preferred regulation point.
Wang L, Lai L, Ouyang Q, Tang C. Wang L, et al. PLoS One. 2011 Jan 25;6(1):e16362. doi: 10.1371/journal.pone.0016362. PLoS One. 2011. PMID: 21283535 Free PMC article. - Regulation of nitrogen metabolism in Escherichia coli and Klebsiella aerogenes: studies with the continuous-culture technique.
Senior PJ. Senior PJ. J Bacteriol. 1975 Aug;123(2):407-18. doi: 10.1128/jb.123.2.407-418.1975. J Bacteriol. 1975. PMID: 238954 Free PMC article. - The multifarious short-term regulation of ammonium assimilation of Escherichia coli: dissection using an in silico replica.
Bruggeman FJ, Boogerd FC, Westerhoff HV. Bruggeman FJ, et al. FEBS J. 2005 Apr;272(8):1965-85. doi: 10.1111/j.1742-4658.2005.04626.x. FEBS J. 2005. PMID: 15819889 - Unveiling cellular biochemical reactions via metabolomics-driven approaches.
Saito N, Ohashi Y, Soga T, Tomita M. Saito N, et al. Curr Opin Microbiol. 2010 Jun;13(3):358-62. doi: 10.1016/j.mib.2010.04.006. Epub 2010 Apr 27. Curr Opin Microbiol. 2010. PMID: 20430690 Review. - Translational Metabolomics of Head Injury: Exploring Dysfunctional Cerebral Metabolism with Ex Vivo NMR Spectroscopy-Based Metabolite Quantification.
Wolahan SM, Hirt D, Glenn TC. Wolahan SM, et al. In: Kobeissy FH, editor. Brain Neurotrauma: Molecular, Neuropsychological, and Rehabilitation Aspects. Boca Raton (FL): CRC Press/Taylor & Francis; 2015. Chapter 25. In: Kobeissy FH, editor. Brain Neurotrauma: Molecular, Neuropsychological, and Rehabilitation Aspects. Boca Raton (FL): CRC Press/Taylor & Francis; 2015. Chapter 25. PMID: 26269925 Free Books & Documents. Review.
Cited by
- Invariance and optimality in the regulation of an enzyme.
Reznik E, Yohe S, Segrè D. Reznik E, et al. Biol Direct. 2013 Mar 22;8:7. doi: 10.1186/1745-6150-8-7. Biol Direct. 2013. PMID: 23522082 Free PMC article. - Social interaction, noise and antibiotic-mediated switches in the intestinal microbiota.
Bucci V, Bradde S, Biroli G, Xavier JB. Bucci V, et al. PLoS Comput Biol. 2012;8(4):e1002497. doi: 10.1371/journal.pcbi.1002497. Epub 2012 Apr 26. PLoS Comput Biol. 2012. PMID: 22577356 Free PMC article. - Achieving optimal growth through product feedback inhibition in metabolism.
Goyal S, Yuan J, Chen T, Rabinowitz JD, Wingreen NS. Goyal S, et al. PLoS Comput Biol. 2010 Jun 3;6(6):e1000802. doi: 10.1371/journal.pcbi.1000802. PLoS Comput Biol. 2010. PMID: 20532205 Free PMC article. - Growth-limiting intracellular metabolites in yeast growing under diverse nutrient limitations.
Boer VM, Crutchfield CA, Bradley PH, Botstein D, Rabinowitz JD. Boer VM, et al. Mol Biol Cell. 2010 Jan 1;21(1):198-211. doi: 10.1091/mbc.e09-07-0597. Epub 2009 Nov 4. Mol Biol Cell. 2010. PMID: 19889834 Free PMC article. - Metabolomics in systems microbiology.
Reaves ML, Rabinowitz JD. Reaves ML, et al. Curr Opin Biotechnol. 2011 Feb;22(1):17-25. doi: 10.1016/j.copbio.2010.10.001. Epub 2010 Nov 1. Curr Opin Biotechnol. 2011. PMID: 21050741 Free PMC article. Review.
References
- Alibhai M, Villafranca JJ (1994) Kinetic and mutagenic studies of the role of the active site residues Asp-50 and Glu-327 of Escherichia coli glutamine synthetase. Biochemistry 33: 682–686 - PubMed
- Aminot A, Kirkwood DS, Kerouel R (1997) Determination of ammonia in seawater by the indophenol-blue method: evaluation of the ICES NUTS I/C 5 questionnaire. Marine Chem 56: 59–75
- Bajad SU, Lu W, Kimball EH, Yuan J, Peterson C, Rabinowitz JD (2006) Separation and quantitation of water soluble cellular metabolites by hydrophilic interaction chromatography-tandem mass spectrometry. J Chromatogr A 1125: 76–88 - PubMed
Publication types
MeSH terms
Substances
LinkOut - more resources
Full Text Sources


