Quantifying cellular interaction dynamics in 3D fluorescence microscopy data - PubMed (original) (raw)
Quantifying cellular interaction dynamics in 3D fluorescence microscopy data
Frederick Klauschen et al. Nat Protoc. 2009.
Abstract
The wealth of information available from advanced fluorescence imaging techniques used to analyze biological processes with high spatial and temporal resolution calls for high-throughput image analysis methods. Here, we describe a fully automated approach to analyzing cellular interaction behavior in 3D fluorescence microscopy images. As example application, we present the analysis of drug-induced and S1P(1)-knockout-related changes in bone-osteoclast interactions. Moreover, we apply our approach to images showing the spatial association of dendritic cells with the fibroblastic reticular cell network within lymph nodes and to microscopy data regarding T-B lymphocyte synapse formation. Such analyses that yield important information about the molecular mechanisms determining cellular interaction behavior would be very difficult to perform with approaches that rely on manual/semi-automated analyses. This protocol integrates adaptive threshold segmentation, object detection, adaptive color channel merging, and neighborhood analysis and permits rapid, standardized, quantitative analysis and comparison of the relevant features in large data sets.
Figures
Figure 1
Automated threshold segmentation. Example original (A) fluorescence two-photon image and intensity histograms showing the characteristic shape (B,C). Histograms can be divided into 1) a “peak” region (lower intensity values) and 2) a “constant” region stretching from the end of the “peak” region to higher intensity values. B) osteoclasts (green) and C) bone tissue (blue). D) Resulting segmented image after automated thresholding using maximum curvature estimation method for threshold selection illustrated in E and F. E) The curvature of the graph of the histogram fit (red) is shown in blue. Selection of the threshold at the curvature maximum is indicated by blue arrow. The approximation of the maximum curvature computation by the slope constant criterion f'(x)≈Δh/Δi=1 is depicted by the green curve and arrow. Scale bar represents 10μm. All animal procedures used in this study have been approved by the Animal Care and Use Committee, NIAID, NIH.
Figure 2
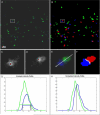
Adaptive channel merging. A, Original image data of T (green) and B (blue) cells. B, segmentation result, interacting T cells (red), interface (white). Magnification of blue (C) and green (D) channels with overlay (E) and segmentation result (F) from inset in A, B. Intensity profile along arrow in E is shown in G. Horizontal green and blue lines in G indicate computed threshold. Black vertical lines (1, 2, and 3) show the selection alternatives of the border between the blue and green channels under the condition that (1) either the blue or (3) the green object is given priority. (2) is the result of the border selection when comparing absolute intensities of competing channels. H, normalized intensity profile allows for balanced identification of the border between color channels (result shown in F). Scale bar represents 10 μm. All animal procedures used in this study have been approved by the Animal Care and Use Committee, NIAID, NIH.
Figure 3
Analysis of the impact of variations in the derivative constant on the normalized interface area (ratio interface area / total bone surface area) and on the difference between “wild-type” and “knock-out” groups. Mean values are based on 20 data sets each in each group. While changing the derivative constant by a factor of 2 in both directions relative to 1.0 results in average normalized interface area changes of ~10%, the differences change only 1.1% (0.5→1.0) and 2.2% (1.0→2.0). Scale bar represents 10 μm. See also Figure 5. (For more information on the experiments see Ishii et al., Nature, in press). All animal procedures used in this study have been approved by the Animal Care and Use Committee, NIAID, NIH.
Figure 4
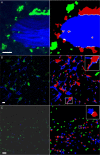
Segmentation example results. Left column: original images; right column: segmentation results. A) Bone-osteoclast interaction (osteoclasts: green; bone: blue; red: interacting osteoclasts). B) Dendritic cells (green/red) and fiber network (blue) in lymph nodes. (white: interface area). Analysis of the whole 3-D data set reveals that 22% of the DC surface is attached to fibers. C) T-B-cell interaction in lymph nodes (T cells: green/red; B cells: blue). Scale bars represent 10 μm. All animal procedures used in this study have been approved by the Animal Care and Use Committee, NIAID, NIH.
Similar articles
- Meaningful interpretation of subdiffusive measurements in living cells (crowded environment) by fluorescence fluctuation microscopy.
Baumann G, Place RF, Földes-Papp Z. Baumann G, et al. Curr Pharm Biotechnol. 2010 Aug;11(5):527-43. doi: 10.2174/138920110791591454. Curr Pharm Biotechnol. 2010. PMID: 20553227 Free PMC article. - Bone Imaging: Osteoclast and Osteoblast Dynamics.
Kikuta J, Ishii M. Kikuta J, et al. Methods Mol Biol. 2018;1763:1-9. doi: 10.1007/978-1-4939-7762-8_1. Methods Mol Biol. 2018. PMID: 29476483 - Robust and automated three-dimensional segmentation of densely packed cell nuclei in different biological specimens with Lines-of-Sight decomposition.
Mathew B, Schmitz A, Muñoz-Descalzo S, Ansari N, Pampaloni F, Stelzer EH, Fischer SC. Mathew B, et al. BMC Bioinformatics. 2015 Jun 8;16:187. doi: 10.1186/s12859-015-0617-x. BMC Bioinformatics. 2015. PMID: 26049713 Free PMC article. - [Dynamic analysis of immune inflammation and bone destruction by intravital imaging].
Kikuta J, Ishii M. Kikuta J, et al. Nihon Rinsho Meneki Gakkai Kaishi. 2016;39(2):124-9. doi: 10.2177/jsci.39.124. Nihon Rinsho Meneki Gakkai Kaishi. 2016. PMID: 27212598 Review. Japanese. - Quantification and its applications in fluorescent microscopy imaging.
Hamilton N. Hamilton N. Traffic. 2009 Aug;10(8):951-61. doi: 10.1111/j.1600-0854.2009.00938.x. Epub 2009 May 5. Traffic. 2009. PMID: 19500318 Review.
Cited by
- TOLOMEO, a Novel Machine Learning Algorithm to Measure Information and Order in Correlated Networks and Predict Their State.
Miotto M, Monacelli L. Miotto M, et al. Entropy (Basel). 2021 Aug 31;23(9):1138. doi: 10.3390/e23091138. Entropy (Basel). 2021. PMID: 34573763 Free PMC article. - Frontiers in Intravital Multiphoton Microscopy of Cancer.
Perrin L, Bayarmagnai B, Gligorijevic B. Perrin L, et al. Cancer Rep (Hoboken). 2020 Feb;3(1):e1192. doi: 10.1002/cnr2.1192. Epub 2019 Jun 20. Cancer Rep (Hoboken). 2020. PMID: 32368722 Free PMC article. Review. - In Vivo 3D Histomorphometry Quantifies Bone Apposition and Skeletal Progenitor Cell Differentiation.
Yeh SA, Wilk K, Lin CP, Intini G. Yeh SA, et al. Sci Rep. 2018 Apr 3;8(1):5580. doi: 10.1038/s41598-018-23785-6. Sci Rep. 2018. PMID: 29615817 Free PMC article. - Automated profiling of individual cell-cell interactions from high-throughput time-lapse imaging microscopy in nanowell grids (TIMING).
Merouane A, Rey-Villamizar N, Lu Y, Liadi I, Romain G, Lu J, Singh H, Cooper LJ, Varadarajan N, Roysam B. Merouane A, et al. Bioinformatics. 2015 Oct 1;31(19):3189-97. doi: 10.1093/bioinformatics/btv355. Epub 2015 Jun 9. Bioinformatics. 2015. PMID: 26059718 Free PMC article. - Quantification of the heterogeneity of prognostic cellular biomarkers in ewing sarcoma using automated image and random survival forest analysis.
Bühnemann C, Li S, Yu H, Branford White H, Schäfer KL, Llombart-Bosch A, Machado I, Picci P, Hogendoorn PC, Athanasou NA, Noble JA, Hassan AB. Bühnemann C, et al. PLoS One. 2014 Sep 22;9(9):e107105. doi: 10.1371/journal.pone.0107105. eCollection 2014. PLoS One. 2014. PMID: 25243408 Free PMC article.
References
- Stoll S, Delon J, Brotz TM, Germain RN. Dynamic imaging of T cell-dendritic cell interactions in lymph nodes. Science (New York, N.Y. 2002;296:1873–1876. - PubMed
- Fisher DT, et al. Hurdles to lymphocyte trafficking in the tumor microenvironment: implications for effective immunotherapy. Immunological investigations. 2006;35:251–277. - PubMed
- Nishida H, Okabe S. Visualization of synapse-glia dynamics. Brain and nerve = Shinkei kenkyu no shinpo. 2007;59:755–761. - PubMed
Publication types
MeSH terms
LinkOut - more resources
Full Text Sources
Research Materials


