Cell-specific protein phenotypes for the autoimmune locus IL2RA using a genotype-selectable human bioresource - PubMed (original) (raw)
doi: 10.1038/ng.434. Epub 2009 Aug 23.
Vincent Plagnol, Erik Fung, Jennie H M Yang, Kate Downes, Jason D Cooper, Sarah Nutland, Gillian Coleman, Matthew Himsworth, Matthew Hardy, Oliver Burren, Barry Healy, Neil M Walker, Kerstin Koch, Willem H Ouwehand, John R Bradley, Nicholas J Wareham, John A Todd, Linda S Wicker
Affiliations
- PMID: 19701192
- PMCID: PMC2749506
- DOI: 10.1038/ng.434
Cell-specific protein phenotypes for the autoimmune locus IL2RA using a genotype-selectable human bioresource
Calliope A Dendrou et al. Nat Genet. 2009 Sep.
Abstract
Genome-wide association studies (GWAS) have identified over 300 regions associated with more than 70 common diseases. However, identifying causal genes within an associated region remains a major challenge. One approach to resolving causal genes is through the dissection of gene-phenotype correlations. Here we use polychromatic flow cytometry to show that differences in surface expression of the human interleukin-2 (IL-2) receptor alpha (IL2RA, or CD25) protein are restricted to particular immune cell types and correlate with several haplotypes in the IL2RA region that have previously been associated with two autoimmune diseases, type 1 diabetes (T1D) and multiple sclerosis. We confirm our strongest gene-phenotype correlation at the RNA level by allele-specific expression (ASE). We also define key parameters for the design and implementation of post-GWAS gene-phenotype investigations and demonstrate the usefulness of a large bioresource of genotype-selectable normal donors from whom fresh, primary cells can be analyzed.
Figures
Figure 1
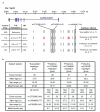
The four common IL2RA/CD25 haplotypes and summary of the subject statistics by haplotype group. (a) The three independent T1D-associated SNP groups are located in the non-coding, 5′ and intron 1 regions of the IL-2RA gene on chromosome 10. The number of SNPs per associated group is 8, 3 and 2, as previously described, with each SNP being represented by a vertical bar-. Gray bars represent susceptibility alleles at these SNPs; the red, blue and orange bars represent protective alleles for each respective SNP group. The most associated SNPs in each group are rs12722495 (A>G), rs11594656 (T>A), and rs2104286 (A>G). The major alleles at all three SNPs are T1D susceptible and minor alleles are protective. Using the genotypes at these SNPs, four common haplotypes can be defined: “Susceptible”, “rs12722495”, “rs11594656”, and “rs2104286”. The frequency of these haplotypes in ≈9,000 healthy control individuals is shown, and the T1D association and odds ratios (OR) of the protective haplotypes were calculated relative to the ‘Susceptible’ haplotype using ≈7,000 case and ≈9,000 control samples (Supplementary Table 1). Chr, chromosome; kb, kilobases; Freq, frequency. (b) Statistics for the 179 individuals analysed in total. Individuals in the rs2104286 haplotype group did not have protective rs12722495 alleles. No individuals were heterozygous for two different protective haplotypes. SNP alleles are shown in the brackets. Hom, homozygotes; Het, heterozygotes; yr, year.
Figure 2
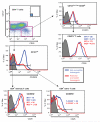
Gating strategy for CD4+ T-cell subsets. CD4+ T cells were gated based on their expression of IL-7R (CD127) and CD25 (inset plot shows isotype control staining). CD127hi cells were further subdivided by their CD45RA expression, with CD45RA− cells constituting the CD4+ memory T cell subset (14-76% of CD4+ T cells), and CD45RA+ cells constituting the CD4+ naive T cell subset (4-63% of CD4+ T cells). The CD127int-low CD25hi cells were gated on FOXP3 expression so as to define the FOXP3+ T-cell subpopulation (2-9% of CD4+ T cells). Representative CD25 expression profiles from individuals homozygous for susceptible alleles at all three SNPs (blue) and homozygous for rs12722495 protective alleles (and thus for rs2104286 protective alleles also because of the haplotype structure) (red) are shown for the CD4+ memory, naïve and FOXP3+ T cells. Samples from these individuals were obtained in the same donation session. Gray histograms are isotype control staining profiles. “Percent of max” is the cell number in each bin divided by the cell number in the bin containing the largest cell number; this statistic is calculated to normalize for different numbers of events collected for each sample that is overlaid. MFI, mean fluorescence intensity; MEF, molecules of equivalent fluorochrome.
Figure 3
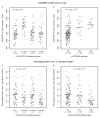
IL2RA genotype and CD4+ T-cell phenotype correlations. (a) Individuals with at least one protective rs12722495 allele have higher CD25 expression on their CD4+ memory T cells (mean CD25 MEF=1,000) than fully susceptible individuals (mean=773) or protected rs11594656 (mean=810) or rs2104286 (mean=783) donors (1-d.f. _P_=4.3×10⁻⁹). (b) rs12722495 gene dosage effect on the CD25 MEF of CD4+ memory T cells (1-d.f. _P_=1.16×10⁻¹⁰). At rs12722495 A>G, where A=susceptible allele, G=protective allele. For AA, AG and GG donors mean CD25 MEF=788, 962 and 1,048, respectively. (c) Individuals with one or two protective rs2104286 alleles in the rs2104286 or rs12722495 haplotype groups, have a lower percentage of naïve cells that are CD25+ (for protective rs2104286 and rs12722495 donors mean=14 and 17%, respectively), compared to fully susceptible individuals or protected rs11594656 donors (mean=22 and 21% respectively; 1-d.f. _P_=1.6×10⁻³). (d) rs2104286 gene dosage effect on the percentage of CD4+ naive T cells that are CD25+ (1-d.f. _P_=4.25×10⁻⁶). At rs2104286 A>G, A=susceptible allele, G=protective allele. For AA, AG and GG donors mean percentage of CD4+ naïve cells that are CD25+=22, 20 and 11%, respectively. For the “combined” rs2104286 genotype, individuals with one or two protective alleles at this SNP are included regardless of allelic status at rs12722495. Susc., susceptible.
Figure 4
IL-2 secretion by stimulated CD69+ CD4+ T cell subsets. (a) Plot showing that unstimulated CD4+ memory T cells do not upregulate CD69 at their cell surface and do not secrete IL-2. (b) Upon stimulation of isolated PBMCs for 4 hours with 5 μg/ml of staphylococcal enterotoxin B (SEB), a proportion of CD4+ memory T cells became CD69+ and secreted IL-2. (c) Eight pairs of previously immunophenotyped donors were recalled such that in each pair one donor was homozygous for the protective rs12722495 haplotype and one donor was homozygous for the fully susceptible haplotype (and had CD4+ memory T cells with CD25 levels <800 MEF). Susceptible donors were selected to have low CD25 levels on their CD4+ memory cells in order to test the hypothesis that differential CD25 expression results in differential IL-2 production. A higher proportion of the CD69+ CD4+ memory T cells from protective donors secrete IL-2 compared to fully susceptible donors (_P_=5.74×10⁻⁴). The average difference in CD25 levels of the unstimulated CD4+ memory T cells between the protective and susceptible donors (23.2%) corresponds to the average difference in IL-2 secretion observed for these donors (22.5%). (d) A genotypic correlation was not observed for the proportion of CD69+ CD4+ naïve T cells secreting IL-2 (_P_=0.318).
Similar articles
- Relationship between Multiple Sclerosis-Associated IL2RA Risk Allele Variants and Circulating T Cell Phenotypes in Healthy Genotype-Selected Controls.
Buhelt S, Søndergaard HB, Oturai A, Ullum H, von Essen MR, Sellebjerg F. Buhelt S, et al. Cells. 2019 Jun 25;8(6):634. doi: 10.3390/cells8060634. Cells. 2019. PMID: 31242590 Free PMC article. - Multiple autoimmune-associated variants confer decreased IL-2R signaling in CD4+ CD25(hi) T cells of type 1 diabetic and multiple sclerosis patients.
Cerosaletti K, Schneider A, Schwedhelm K, Frank I, Tatum M, Wei S, Whalen E, Greenbaum C, Kita M, Buckner J, Long SA. Cerosaletti K, et al. PLoS One. 2013 Dec 23;8(12):e83811. doi: 10.1371/journal.pone.0083811. eCollection 2013. PLoS One. 2013. PMID: 24376757 Free PMC article. - IL2RA genetic heterogeneity in multiple sclerosis and type 1 diabetes susceptibility and soluble interleukin-2 receptor production.
Maier LM, Lowe CE, Cooper J, Downes K, Anderson DE, Severson C, Clark PM, Healy B, Walker N, Aubin C, Oksenberg JR, Hauser SL, Compston A, Sawcer S; International Multiple Sclerosis Genetics Consortium; De Jager PL, Wicker LS, Todd JA, Hafler DA. Maier LM, et al. PLoS Genet. 2009 Jan;5(1):e1000322. doi: 10.1371/journal.pgen.1000322. Epub 2009 Jan 2. PLoS Genet. 2009. PMID: 19119414 Free PMC article. - IL-2 and its high-affinity receptor: genetic control of immunoregulation and autoimmunity.
Wang J, Wicker LS, Santamaria P. Wang J, et al. Semin Immunol. 2009 Dec;21(6):363-71. doi: 10.1016/j.smim.2009.04.004. Epub 2009 May 15. Semin Immunol. 2009. PMID: 19447046 Review. - The Genotype and Phenotype (GaP) registry: a living biobank for the analysis of quantitative traits.
Gregersen PK, Klein G, Keogh M, Kern M, DeFranco M, Simpfendorfer KR, Kim SJ, Diamond B. Gregersen PK, et al. Immunol Res. 2015 Dec;63(1-3):107-12. doi: 10.1007/s12026-015-8711-8. Immunol Res. 2015. PMID: 26467974 Review.
Cited by
- Human IL2RA null mutation mediates immunodeficiency with lymphoproliferation and autoimmunity.
Goudy K, Aydin D, Barzaghi F, Gambineri E, Vignoli M, Ciullini Mannurita S, Doglioni C, Ponzoni M, Cicalese MP, Assanelli A, Tommasini A, Brigida I, Dellepiane RM, Martino S, Olek S, Aiuti A, Ciceri F, Roncarolo MG, Bacchetta R. Goudy K, et al. Clin Immunol. 2013 Mar;146(3):248-61. doi: 10.1016/j.clim.2013.01.004. Epub 2013 Jan 24. Clin Immunol. 2013. PMID: 23416241 Free PMC article. - Bayesian refinement of association signals for 14 loci in 3 common diseases.
Wellcome Trust Case Control Consortium; Maller JB, McVean G, Byrnes J, Vukcevic D, Palin K, Su Z, Howson JM, Auton A, Myers S, Morris A, Pirinen M, Brown MA, Burton PR, Caulfield MJ, Compston A, Farrall M, Hall AS, Hattersley AT, Hill AV, Mathew CG, Pembrey M, Satsangi J, Stratton MR, Worthington J, Craddock N, Hurles M, Ouwehand W, Parkes M, Rahman N, Duncanson A, Todd JA, Kwiatkowski DP, Samani NJ, Gough SC, McCarthy MI, Deloukas P, Donnelly P. Wellcome Trust Case Control Consortium, et al. Nat Genet. 2012 Dec;44(12):1294-301. doi: 10.1038/ng.2435. Epub 2012 Oct 28. Nat Genet. 2012. PMID: 23104008 Free PMC article. - Associations of Independent IL2RA Gene Variants with Intermediate Uveitis.
Lindner E, Weger M, Ardjomand N, Renner W, El-Shabrawi Y. Lindner E, et al. PLoS One. 2015 Jul 2;10(7):e0130737. doi: 10.1371/journal.pone.0130737. eCollection 2015. PLoS One. 2015. PMID: 26133380 Free PMC article. - Single nucleotide polymorphisms in multiple sclerosis: disease susceptibility and treatment response biomarkers.
Pravica V, Popadic D, Savic E, Markovic M, Drulovic J, Mostarica-Stojkovic M. Pravica V, et al. Immunol Res. 2012 Apr;52(1-2):42-52. doi: 10.1007/s12026-012-8273-y. Immunol Res. 2012. PMID: 22392049 Review. - Effective recruitment of participants to a phase I study using the internet and publicity releases through charities and patient organisations: analysis of the adaptive study of IL-2 dose on regulatory T cells in type 1 diabetes (DILT1D).
Heywood J, Evangelou M, Goymer D, Kennet J, Anselmiova K, Guy C, O'Brien C, Nutland S, Brown J, Walker NM, Todd JA, Waldron-Lynch F. Heywood J, et al. Trials. 2015 Mar 11;16:86. doi: 10.1186/s13063-015-0583-7. Trials. 2015. PMID: 25881192 Free PMC article. Clinical Trial.
References
- Donnelly P. Progress and challenges in genome-wide association studies in humans. Nature. 2008;456:728–731. - PubMed
- Lowe CE, et al. Large-scale genetic fine mapping and genotype-phenotype associations implicate polymorphism in the IL2RA region in type 1 diabetes. Nat. Genet. 2007;39:1074–1082. - PubMed
- Dendrou CA, Wicker LS. The IL-2/CD25 pathway determines susceptibility to T1D in humans and NOD mice. J. Clin. Immunol. 2008;28:685–696. - PubMed
Publication types
MeSH terms
Substances
Grants and funding
- 061859/WT_/Wellcome Trust/United Kingdom
- P01 AI039671/AI/NIAID NIH HHS/United States
- WT_/Wellcome Trust/United Kingdom
- 061858/WT_/Wellcome Trust/United Kingdom
- P01 AI39671/AI/NIAID NIH HHS/United States
LinkOut - more resources
Full Text Sources
Other Literature Sources


