Widespread shortening of 3'UTRs by alternative cleavage and polyadenylation activates oncogenes in cancer cells - PubMed (original) (raw)
Widespread shortening of 3'UTRs by alternative cleavage and polyadenylation activates oncogenes in cancer cells
Christine Mayr et al. Cell. 2009.
Abstract
In cancer cells, genetic alterations can activate proto-oncogenes, thereby contributing to tumorigenesis. However, the protein products of oncogenes are sometimes overexpressed without alteration of the proto-oncogene. Helping to explain this phenomenon, we found that when compared to similarly proliferating nontransformed cell lines, cancer cell lines often expressed substantial amounts of mRNA isoforms with shorter 3' untranslated regions (UTRs). These shorter isoforms usually resulted from alternative cleavage and polyadenylation (APA). The APA had functional consequences, with the shorter mRNA isoforms exhibiting increased stability and typically producing ten-fold more protein, in part through the loss of microRNA-mediated repression. Moreover, expression of the shorter mRNA isoform of the proto-oncogene IGF2BP1/IMP-1 led to far more oncogenic transformation than did expression of the full-length, annotated mRNA. The high incidence of APA in cancer cells, with consequent loss of 3'UTR repressive elements, suggests a pervasive role for APA in oncogene activation without genetic alteration.
Figures
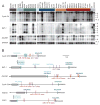
Figure 1. APA leads to shorter 3′UTRs
(A) Northern blots of human cell lines and tissues, successively stripped and reprobed for the indicated mRNAs. Groupings include sarcoma cell lines (brown), normal lung tissue, cultured human bronchial epithelial cells (NHBE) and immortalized lung epithelial cell line (Beas-2B, light green), lung cancer cell lines (dark green), normal colon tissue (light blue), colon cancer cell lines (dark blue), normal breast tissue and immortalized breast epithelial cell lines (orange), breast cancer cell lines (red), and other cell lines (grey), which were immortalized fibroblasts (HF) and an embryonic kidney cell line (HEK293). GAPDH expression served as loading control. Migration of markers with lengths indicated (kb) is shown at the right. (B) Schematic illustration of mRNAs with alternative isoforms due to APA. Grey boxes show protein coding region; black line represents untranslated regions, and AAAAAA represents the poly(A) tail. Shown are functional APA signals identified by 3′ RACE, with signals conserved at the orthologous position in four genomes (human, mouse, rat, dog) in dark blue, and more poorly conserved signals in light blue. Brackets indicate closely spaced signals. Also shown are negative regulatory elements identified in the 3′UTRs, including AU-rich elements (ARE, green), let-7 sites (purple), and sites to the other widely expressed miRNA with the most sites in that 3′UTR (red).
Figure 2. APA leads to shorter 3′UTRs preferentially in cancer cells
(A) Quantification of alternative mRNA isoforms. Expression ratio of shortest to longest mRNA isoform from Figures 1A and S2 was normalized to that of the corresponding normal tissue and shown as log2 values. For the sarcoma cell lines no normal tissue was available, therefore the values were normalized to the median of expression of all normal tissues. IMP-1 was not expressed in any of the normal tissues, and thus IMP-1 ratios were normalized to that of HEK293, because for the other genes examined the expression ratios of the mRNA isoforms in HEK293 cells were similar to those of the normal tissues. FGF2 was not expressed in normal breast tissue; therefore FGF2 ratios of the breast cell lines were normalized to that MCF10A, a non-transformed breast epithelial line, whose expression ratio of short and long mRNA isoforms resembled that of normal breast tissue for the other genes analyzed. Ratios used for normalization are shaded grey; those with a higher fraction of shorter isoform are purple; those with a lower fraction of shorter isoform are shaded light blue, and cases without detectable mRNA are blank. Cells and tissues are color-coded as in Figure 1A. (B) Distributions of alternative mRNAs for cancer cells and non-transformed cells. Plotted are the values from Figure 2A, which are the expression ratios of shorter to longer mRNA isoforms, normalized to the corresponding normal tissue. The value for Cyclin D1 in the breast cancer cell line MB453, which was 8.5 (log2), is not included because a deletion encompassing the 3′UTR is responsible for the shorter mRNA (Lebwohl et al., 1994). For non-transformed cell lines, the distribution is not significantly displaced from zero (p = 0.35), indicating similar ratios of shorter to longer mRNA isoforms as the normal tissues. For cancer cell lines, the ratio is significantly displaced from both zero (p <10−4) and the distribution for non-transformed cell lines (p <10−4), indicating increased ratios of the shorter isoforms. (C) Genome-wide analyses of 3′UTR length and cellular proliferation. The figure is redrawn from Sandberg et al. (2008), except data points are colored to indicate different types of samples, with cancer samples red (including 22 cancer cell lines and 1 cancer sample), non-transformed cell lines light blue, blood cells (including resting and stimulated T cells, B cells and monocytes) dark blue and normal tissues black. The tandem UTR length index (TLI) is a relative measure of 3′UTR length derived from array data(Sandberg et al., 2008). (D) The 3′UTR length as measured by TLI for different sample types, focusing only on proliferating cells. TLI values from samples of panel (C) above a proliferation threshold of proliferation index = 0.6 [dotted line in panel (C)] were plotted (median, horizontal line; 25th through 75th percentile, box; range, error bars; outliers, *).
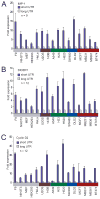
Figure 3. The shortest mRNA isoform leads to higher protein expression than does the full-length isoform
(A) Luciferase expression from a reporter containing the 3′UTR of the shortest IMP-1 isoform, compared to that from the reporter containing the 3′UTR of the full-length IMP-1 isoform. Assays were performed in 16 cell lines from various tissues, color-coded as in Figure 1A. The number of transfections is shown (n = 9, performed in three independent experiments, each with three transfections of each reporter), with error bars indicating the standard deviation for these transfections. (B) As in (A), but using reporters with the DICER1 3′UTRs. (C) As in (A), but using reporters with the Cyclin D2 3′UTRs.
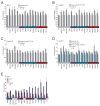
Figure 4. Contributions of miRNA regulation and 3′UTR length to the difference in protein expression observed between the long and the short mRNA isoforms
(A) Repression of the IMP-1 3′UTR by the let-7 miRNA endogenously expressed within the cells. Luciferase expression of a reporter possessing the full-length IMP-1 3′UTR with five mutant let-7 sites (long-mut-let-7) is compared with that of a reporter with five intact let-7 sites (long-wt, Figure 1B). The number of transfections is shown (n = 18, performed in six independent experiments, each with three transfections of each reporter), with error bars indicating standard deviation. Cells are color-coded as in Figure 1A. (B) Repression of the DICER1 3′UTR by the miR-103/107 endogenously expressed within the cells. As in (A) but examining the contribution of the six miR-103/107 sites in the full-length DICER1 3′UTR. (C) Repression of the Cyclin D2 3′UTR by the miR-15/16 endogenously expressed within the cells. As in (A) but examining the contribution of the three miR-15/16 sites in the full-length Cyclin D2 3′UTR. (D) Repression of the DICER1 3′UTR by the let-7 miRNA endogenously expressed within the cells. As in (B) but examining the contribution of the two let-7 sites, disrupting either only the two let-7 sites (long-mut-let-7) or both the two let-7 sites and the six miR-103/107 sites (long-mut-all). (E) Influence of the length of the IMP-1 3′UTR on protein expression. The reverse complement (rc) of the difference between the shortest and the full-length mRNA isoforms of IMP-1 was cloned downstream the shortest 3′UTR, while mutating the proximal poly(A) signal. Expression of the reporter possessing the shortest 3′UTR and of that also possessing the rc, each normalized to expression of the reporter containing the full-length isoform. The number of transfections is shown (n = 9, performed in three independent experiments, each with three transfections of each reporter), with error bars indicating standard deviation.
Figure 5. Functional consequences of expressing short or long mRNA isoforms
(A) The short mRNA isoform of Cyclin D2 increases the fraction of cells in S phase. For MCF7 cells stably transduced with retroviral vectors, the percentage of cells that were in G1 and S phase were measured using fluorescence-activated cell sorting (FACS) analysis. Plotted is the mean (± s.d.) of three independent experiments. (B) The short mRNA isoform of IMP-1 promotes oncogenic transformation. For NIH3T3 cells stably transduced with retroviral vectors, the percentage that yielded colonies after 28 days was plotted (median, horizontal line; 25th through 75th percentile, box; range, error bars; outlier, *; n = 18 from six independent experiments, each in triplicate). The vectors expressed either the long mRNA isoform of IMP-1 with mutations designed to prevent APA but retaining intact let-7 sites (IMP-1-long-wt) or the analogous long mRNA isoform with mutant let-7 sites (IMP-1-long-mut) or the shortest mRNA isoform of IMP-1 (IMP-1-short).
Similar articles
- Alternative cleavage and polyadenylation in spermatogenesis connects chromatin regulation with post-transcriptional control.
Li W, Park JY, Zheng D, Hoque M, Yehia G, Tian B. Li W, et al. BMC Biol. 2016 Jan 22;14:6. doi: 10.1186/s12915-016-0229-6. BMC Biol. 2016. PMID: 26801249 Free PMC article. - Lengthening of 3' Untranslated Regions of mRNAs by Alternative Polyadenylation Is Associated With Tumor Progression and Poor Prognosis of Clear Cell Renal Cell Carcinoma.
Zhang F, Chen L, Li W, Yang C, Xiong M, Zhou M, Kazobinka G, Zhao J, Hou T. Zhang F, et al. Lab Invest. 2023 Jun;103(6):100125. doi: 10.1016/j.labinv.2023.100125. Epub 2023 Mar 6. Lab Invest. 2023. PMID: 36889542 - 3'UTR shortening and EGF signaling: implications for breast cancer.
Akman HB, Oyken M, Tuncer T, Can T, Erson-Bensan AE. Akman HB, et al. Hum Mol Genet. 2015 Dec 15;24(24):6910-20. doi: 10.1093/hmg/ddv391. Epub 2015 Sep 22. Hum Mol Genet. 2015. PMID: 26395459 - Regulation and function of alternative polyadenylation in development and differentiation.
Gallicchio L, Olivares GH, Berry CW, Fuller MT. Gallicchio L, et al. RNA Biol. 2023 Jan;20(1):908-925. doi: 10.1080/15476286.2023.2275109. Epub 2023 Oct 31. RNA Biol. 2023. PMID: 37906624 Free PMC article. Review. - The emerging theme of 3'UTR mRNA isoform regulation in reprogramming of cell metabolism.
Zhang Q, Tian B. Zhang Q, et al. Biochem Soc Trans. 2023 Jun 28;51(3):1111-1119. doi: 10.1042/BST20221128. Biochem Soc Trans. 2023. PMID: 37171086 Free PMC article. Review.
Cited by
- Perspectives on the ARE as it turns 25 years old.
Beisang D, Bohjanen PR. Beisang D, et al. Wiley Interdiscip Rev RNA. 2012 Sep-Oct;3(5):719-31. doi: 10.1002/wrna.1125. Epub 2012 Jun 25. Wiley Interdiscip Rev RNA. 2012. PMID: 22733578 Free PMC article. - CPEB1 coordinates alternative 3'-UTR formation with translational regulation.
Bava FA, Eliscovich C, Ferreira PG, Miñana B, Ben-Dov C, Guigó R, Valcárcel J, Méndez R. Bava FA, et al. Nature. 2013 Mar 7;495(7439):121-5. doi: 10.1038/nature11901. Epub 2013 Feb 24. Nature. 2013. PMID: 23434754 - E2F mediates enhanced alternative polyadenylation in proliferation.
Elkon R, Drost J, van Haaften G, Jenal M, Schrier M, Oude Vrielink JA, Agami R. Elkon R, et al. Genome Biol. 2012 Jul 2;13(7):R59. doi: 10.1186/gb-2012-13-7-r59. Genome Biol. 2012. PMID: 22747694 Free PMC article. - Roles of RNA-binding Proteins and Post-transcriptional Regulation in Driving Male Germ Cell Development in the Mouse.
Licatalosi DD. Licatalosi DD. Adv Exp Med Biol. 2016;907:123-51. doi: 10.1007/978-3-319-29073-7_6. Adv Exp Med Biol. 2016. PMID: 27256385 Free PMC article. - Infection of Epstein-Barr virus in a gastric carcinoma cell line induces anchorage independence and global changes in gene expression.
Marquitz AR, Mathur A, Shair KH, Raab-Traub N. Marquitz AR, et al. Proc Natl Acad Sci U S A. 2012 Jun 12;109(24):9593-8. doi: 10.1073/pnas.1202910109. Epub 2012 May 30. Proc Natl Acad Sci U S A. 2012. PMID: 22647604 Free PMC article.
References
- Bishop JM. Molecular themes in oncogenesis. Cell. 1991;64:235–248. - PubMed
- Chen CY, Shyu AB. AU-rich elements: characterization and importance in mRNA degradation. Trends Biochem Sci. 1995;20:465–470. - PubMed
Publication types
MeSH terms
Substances
Grants and funding
- HHMI/Howard Hughes Medical Institute/United States
- R01 GM067031-06/GM/NIGMS NIH HHS/United States
- R01 DK068348/DK/NIDDK NIH HHS/United States
- R01 DK068348-04/DK/NIDDK NIH HHS/United States
- R01 GM067031/GM/NIGMS NIH HHS/United States
- P30 CA008748/CA/NCI NIH HHS/United States
- R01 DK068348-05/DK/NIDDK NIH HHS/United States
LinkOut - more resources
Full Text Sources
Other Literature Sources
Research Materials


